

This guide exists so you don’t make the same call.
India’s demat account count crossed 17 crore in 2025. Most of those account holders open the app, see a number in red or green, and have no idea what they’re actually looking at.
This guide explains how to read your stock portfolio in India — every metric on your Groww or Zerodha Holdings screen, in plain English, with real examples. No jargon. No assumptions about what you already know.
- What Every Number Means
- How to Read Your Groww Portfolio
- What Is XIRR and Why It Matters
- How to Read Your Zerodha Portfolio
- Realised vs Unrealised P&L
- What Does T1 Mean?
- Corporate Actions — Portfolio Overnight Drop
- Tax Reality: What You Actually Keep
- Viewing Stocks Across Brokers
- Myth vs Reality
- Insider Workflow
- Advantages of Understanding Your Portfolio
- Limitations
- Key Takeaways
- Frequently Asked Questions
- Conclusion
What Every Number in Your Stock Portfolio Means
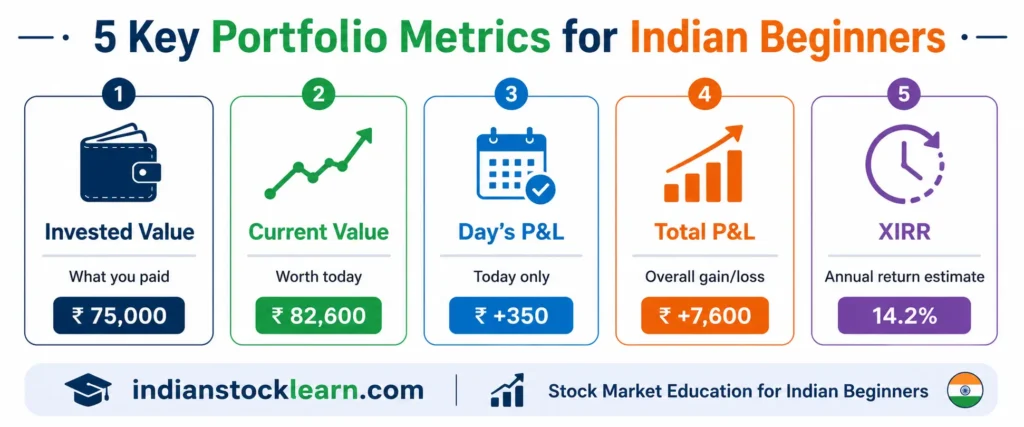
Think of your portfolio as a health report. A medical report shows blood pressure, sugar, and cholesterol separately — each measuring something different. Your portfolio screen works the same way. Every number answers one specific question. Here’s the full picture at a glance:
| Portfolio Term | What It Shows | Why It Matters |
|---|---|---|
| Invested Value | Total amount you paid for your shares | Your baseline — fixed unless you buy or sell |
| Current Value | Live market value of all holdings | Updates every second during market hours |
| Day’s P&L | Today’s price movement only | Resets to zero every trading session |
| Total P&L | Overall gain or loss since you bought | The real measure of your investment progress |
| Return (%) | Profit or loss as a percentage | Lets you compare investments of different sizes |
| XIRR | Annualised return, adjusted for investment dates | Best metric for SIPs and staggered purchases |
Invested Value
The total money you’ve spent buying shares. You bought 10 shares of Reliance at ₹1,400 each → Invested Value is ₹14,000. It stays fixed unless you buy more shares or sell existing ones.
Current Value
What those shares are worth right now at the latest market price. Reliance rises to ₹1,520 → Current Value becomes ₹15,200 (10 × ₹1,520). Because prices change every second during market hours, this number updates continuously.
Day’s Profit & Loss
Shows only what happened today. Portfolio worth ₹15,000 yesterday, closes at ₹15,350 today → shows +₹350 (+2.33%). Resets to zero tomorrow morning. This is the number most beginners stare at — and the one that matters least for long-term investors.
Day’s P&L only reflects one session’s movement. It tells you nothing about whether your overall investment is doing well. A portfolio showing -₹800 today can be up ₹12,000 overall — both numbers are true at the same time.
Total Profit & Loss
Compares Current Value with Invested Value. Invest ₹50,000, portfolio grows to ₹58,000 → Total P&L is +₹8,000. This is what actually tells you how your investment is performing over time.
Return Percentage
Formula: Return % = (Profit ÷ Invested Amount) × 100
Earning ₹5,000 on ₹20,000 (25%) is very different from ₹5,000 on ₹1,00,000 (5%) — same rupee amount, completely different performance. The percentage makes comparison fair.
XIRR
Adjusts your returns based on when each investment was made. Full explanation in Section 3.
How to Read Your Groww Portfolio Step by Step
Groww is clean and beginner-friendly — but the Holdings page still trips up new investors every day. Here’s how to read it from top to bottom without guessing.
Step 1 — Open Holdings
Log into Groww → Stocks → Holdings. You’ll see every stock you currently own: quantity, average purchase price, current market price, and overall gain or loss per stock.
Step 2 — Compare Invested vs Current Value
| Metric | Example | What It Tells You |
|---|---|---|
| Invested Value | ₹75,000 | Total amount you paid |
| Current Value | ₹82,600 | What your holdings are worth now |
| Total Profit | +₹7,600 | Your actual gain so far |
| Overall Return | +10.1% | Gain expressed as a percentage |
Current Value lower than Invested Value? That means the market price dropped below your purchase price. Not a permanent loss — just today’s reading. Prices move every session.
Step 3 — Check Overall Return vs Benchmark
Build this habit early: compare your return with the Nifty 50 over the same period. Portfolio up 14% while Nifty returned 18%? You made money — but the broader market did better. That comparison tells you more about your stock picks than any single number.
Step 4 — Explore Portfolio Analysis
Many Groww users never open this screen. It shows sector allocation, industry distribution, and your best and worst performers. If 80% of your money is in banking stocks, you’re far more exposed to one sector than you realise — and this screen tells you that directly.
What Is XIRR in Groww and Why Does It Matter?
Of all the numbers in your portfolio, XIRR confuses beginners the most. You see 12%, 18%, or even -5% — and you’re not sure whether to be pleased or worried.
XIRR (Extended Internal Rate of Return) estimates your annual return while accounting for both the amount invested and the exact date it was invested.
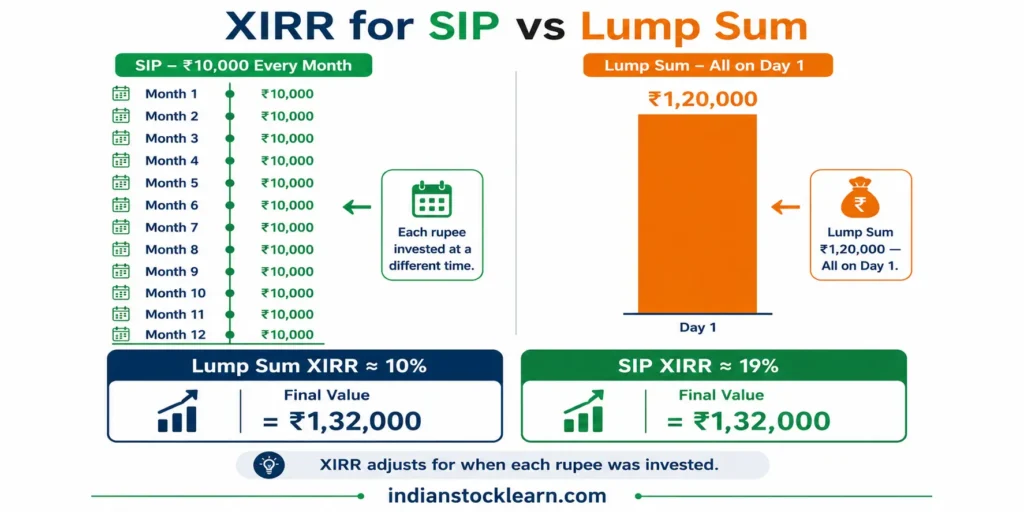
Investing ₹5,000 every month is very different from investing ₹60,000 all at once — even if both end up at the same total. A basic return percentage treats them identically. XIRR doesn’t. That’s exactly why XIRR is more useful for most Indian investors who invest regularly.
Why Basic Return % Fails for SIP Investors
| Investor A — Lump Sum | Investor B — SIP | |
|---|---|---|
| How invested | ₹1,20,000 in one go | ₹10,000/month × 12 |
| Total invested | ₹1,20,000 | ₹1,20,000 |
| Portfolio after 1 year | ₹1,32,000 | ₹1,32,000 |
| Basic return % | 10% | 10% — misleading |
| XIRR (accurate picture) | ~10% | ~18–20% ← the real story |
Both investors put in the same total money and ended at the same value. But Investor B’s first ₹10,000 was invested for 12 months while the last ₹10,000 was in for only one month. XIRR accounts for that timing difference. A flat return percentage ignores it entirely.
The Mango Tree Analogy
Imagine planting 12 mango trees, one every month. After a year, each tree has been growing for a different amount of time. You wouldn’t judge all 12 by the same timeline — that would be unfair to the newest ones. XIRR measures your investments the same way: each rupee by exactly how long it was working.
What Is a Good XIRR?
No fixed answer. As a reference: the Nifty 50 has historically delivered around 12–14% annually over long periods. An XIRR in that range suggests your portfolio is broadly tracking the market. Always consider it alongside diversification, risk level, and your actual time horizon.
How to Read Your Zerodha Portfolio
Zerodha gives you two tools. Most beginners use only one. Here’s what both actually do:
| Tool | Best For | What You Find There |
|---|---|---|
| Kite | Daily use during market hours | Live prices, day’s change, quick P&L overview |
| Console | Monthly review and tax filing | Historical P&L, tax reports, performance chart, dividends |
Kite — Daily Dashboard
Open Holdings in Kite and you’ll see company name, quantity, average purchase price, last traded price, day’s change, and overall P&L per stock. Fast. Useful for a quick market-hours check. Not the right screen for serious portfolio review.
Console — Your Report Card
Console is where the real analysis happens: overall returns, historical performance trends, Profit & Loss reports, tax reports, contract notes, and dividend history. Think of Kite as the speedometer — Console as the full service history of your car.
The Performance Curve
Most beginners never open the Console performance chart. That’s a mistake. Instead of a single number, the chart shows how your portfolio has moved over weeks, months, or years. For long-term investors, that trend line reveals far more than any day’s P&L figure.
Transaction Costs — Don’t Ignore Them
DP charges, exchange transaction charges, GST, stamp duty, brokerage — small individually, but they reduce your net return over time. Many beginners look only at the profit figure and miss these completely. Console shows the full breakdown.
Realised vs Unrealised Profit & Loss
Your portfolio might show a ₹6,000 loss — even though you haven’t sold a single share. Here’s why.
Unrealised Profit or Loss
The gain or loss on shares you still hold. You bought 100 shares of TCS at ₹3,800. Price drops to ₹3,650. Portfolio shows -₹15,000. Nothing has actually happened — you still own 100 shares. That number exists only on paper, and it changes with every market tick.
Realised Profit or Loss
What you actually earn after selling. Bought Reliance at ₹2,500, sold at ₹2,850 → ₹350-per-share gain is now real, settled money. This is also what gets reported for tax purposes — unrealised gains are never taxed.
Why a Red Portfolio Doesn’t Always Mean Trouble
A portfolio down 4% today isn’t a crisis. If your investment horizon is several years, today’s movement is a small blip on a long timeline. Most experienced investors check their portfolio weekly or monthly — not multiple times a day. Hourly checking mostly creates stress without improving returns.
What Does T1 Mean in Stock Holdings?
You buy shares on a Monday morning. By afternoon, they appear in your app with a small T1 tag next to them. Many beginners assume something went wrong. Nothing has.
T+1 Settlement Cycle
Indian stock markets operate on a T+1 settlement cycle for most equity trades. T = trade date. Settlement — the actual legal transfer of ownership — happens the next business day.
You buy shares. They appear in your Holdings as T1. You own them — but settlement is pending.
Ownership is officially transferred. Shares move from T1 to your regular holdings automatically. Nothing needed from your side.
IPO Shares and T1
A similar temporary status appears after an IPO allotment. Newly credited shares may look different before settling into regular holdings. Completely routine — resolves automatically within the settlement window.
How Corporate Actions Distort Your Portfolio Overnight
Most portfolio guides never explain this. And it causes thousands of panicked support tickets every single year.
You wake up Tuesday morning. Open Groww or Zerodha. Your portfolio has apparently crashed 40–50%. No market crash. No bad news. Your stock is just… down 50% by itself. You’re reaching for your phone to sell everything.
Stop. Before you do anything — check for a bonus issue or stock split ex-date.
What Happens on a Bonus Issue Ex-Date
When a company announces a 1:1 bonus share, every shareholder gets one free share for every share they already own. The total company value doesn’t change — so the stock price halves on the ex-date to reflect the doubled share count in the market.
Here’s the problem: your broker app updates the stock price instantly at 9:15 AM on ex-date. But the actual bonus shares take 2–4 working days to reach your demat account via the company’s Registrar and CDSL/NSDL. Your app calculates P&L with your old share count at the new halved price — and shows a massive fake loss.
Company announces 1:1 bonus. Price adjusts to ₹250 on ex-date morning.
Your app: 100 shares × ₹250 = ₹25,000 → shows -50%.
3–4 days later: 100 bonus shares credited. App: 200 × ₹250 = ₹50,000.
You were never actually down. The app was showing half the picture.
The Timeline: What Actually Happens
| Day | What Happens | What Your App Shows |
|---|---|---|
| Ex-Date (Day 1) | Stock price halves at 9:15 AM sharp | Portfolio drops ~50% — fake paper loss |
| Day 2–3 | Depository processes bonus credits via Registrar | Loss still showing — shares not credited yet |
| Day 3–4 | Bonus shares credited to your demat account | Portfolio auto-corrects to original value ✓ |
Before panicking about a sudden portfolio drop — search “[stock name] ex-date” on Google. If there’s a recent bonus or split announcement, close the app and wait 4 days. The correction is automatic. No action needed from your side.
Tax Reality: What Your Green Portfolio Actually Keeps
Your portfolio shows ₹12,000 in profit. You’re ready to celebrate. But how much of that is actually yours to keep?
Most broker dashboards show gross unrealised gains — taxes are never automatically subtracted. Here’s what the actual picture looks like for Indian investors in 2026.
Short-Term Capital Gains (STCG)
Sell shares held 12 months or less → profit taxed at 20% (flat, where STT has been paid on an Indian stock exchange).
Example: A stock rises ₹10,000 in 6 months, you sell. You keep ₹8,000. ₹2,000 goes to tax — whether your broker’s dashboard shows it or not.
Long-Term Capital Gains (LTCG)
Hold more than 12 months → LTCG taxed at 12.5% on gains above ₹1.25 lakh per financial year. Gains below that threshold are entirely tax-free.
This single difference — 20% vs 12.5% — is why experienced investors often hold shares just past the 12-month mark before selling. On a ₹5 lakh gain, that’s ₹37,500 more in your pocket simply by waiting a few more weeks.
The FIFO Accounting Shock
Example: Bought Infosys at ₹1,800 in January 2024, then at ₹1,600 in January 2025. You sell in March 2026 at ₹2,000. Under FIFO, the January 2024 batch is sold first → ₹200 gain, held 12+ months → LTCG at 12.5%. Had the 2025 batch been used → ₹400 gain, STCG at 20%. The batch order matters — and your broker handles it automatically, but knowing this lets you plan sell timing intelligently.
Dividend Tax
Dividends from Indian companies are taxable as ordinary income in your hands — no special exemption. If dividends from any single company exceed ₹5,000 in a year, the company deducts 10% TDS before crediting you. Your broker’s tax report (Zerodha Console or Groww’s P&L section) shows these details for your ITR filing.
Gross-to-Net Reality
| What Your Portfolio Shows | After-Tax Reality |
|---|---|
| Unrealised Gain: ₹12,000 | No tax until you sell — paper only |
| Realised Gain, held < 12 months: ₹12,000 | STCG 20% → you keep ₹9,600 |
| Realised Gain, held > 12 months: ₹12,000 | Below ₹1.25L LTCG limit → you keep ₹12,000 ✓ |
| Realised Gain, held > 12 months: ₹1,50,000 | LTCG 12.5% on ₹25,000 above limit → keep ₹1,46,875 |
| Dividend received: ₹6,000 | 10% TDS deducted → ₹5,400 credited; balance via ITR |
The bottom line: your broker’s green number is always pre-tax. Your actual profit depends on how long you held the shares and your overall tax situation.
Viewing Stocks Across Multiple Brokers
Many investors eventually end up with more than one broker account — Groww for long-term investing, Zerodha for direct equity, and possibly an older account from years back. Logging into three apps every day becomes inconvenient fast.
Consolidated Account Statement (CAS)
The Consolidated Account Statement (CAS) is the practical solution. Provided through India’s depository system (CDSL or NSDL), a CAS combines holdings from all demat accounts linked to your PAN into one document. You can request it directly from the CDSL or NSDL portals — no individual broker login required.
What CAS Doesn’t Do
CAS shows your complete holdings snapshot — not XIRR, not performance vs benchmark, not tax liability. For those, you still need your broker’s individual P&L reports. Think of CAS as the “what I own” document; broker tools for the “how it’s doing” analysis.
Look at the Bigger Picture
Whether you use one broker or three, review your total portfolio periodically rather than each account in isolation. Key things to check: overall diversification across market caps, sector concentration, long-term performance vs Nifty 50, and whether you’re investing consistently month over month.
Myth vs Reality: What Your Portfolio Screen Is Hiding
Portfolio apps show you numbers — but they don’t tell you how to interpret them. Over time, most beginners pick up a set of assumptions about what those numbers mean. Most of those assumptions are wrong.
| ❌ Myth | ✅ Reality |
|---|---|
| “Green portfolio = I’m doing great.” | A green portfolio can be 80% concentrated in 2 stocks, or your XIRR might still be below the Nifty 50. Colour tells you nothing about risk or relative performance. |
| “Red portfolio = I’ve made a mistake.” | Unrealised losses are paper losses. A portfolio down 6% today can recover next week. Long-term investors often ignore short-term dips entirely — and that’s usually the right call. |
| “Day’s P&L is the number that matters most.” | For long-term investors, Day’s P&L is mostly noise. Many experienced investors disable push notifications specifically to stop reacting to moves that have zero bearing on their 5-year plan. |
| “High XIRR always means a great investment.” | XIRR inflates during early SIP stages and after a recent large lump sum (the fresh capital effect). A 35% XIRR held 4 months is very different from 18% sustained over 5 years. |
| “My broker’s profit figure includes all costs.” | Most trackers exclude brokerage, DP charges, GST, and stamp duty from the profit shown. Your actual net return is always slightly lower than what the screen displays. |
Portfolio numbers are a filtered view of reality. They tell you something — but never everything. Reading them well means knowing what each one deliberately leaves out.
Insider Workflow: How Experienced Investors Read Portfolios
Most beginners check their portfolio randomly — whenever the market feels scary, or whenever a notification pops up. Experienced investors follow a completely different process.
The 30-Second Daily Check (Optional)
Glance at Total P&L and XIRR. Skip Day’s P&L entirely unless you’re an active trader. Scan for any single stock down 15%+ — that might signal company-specific news worth checking. If nothing unusual, close the app. That’s it.
If checking your portfolio made you want to act immediately — wait 24 hours before doing anything. Most urges to buy or sell based on a single day’s movement completely pass by the next morning. This one habit preserves more returns than most investment decisions ever will.
The Monthly Deep Dive (10–15 Minutes)
- Compare XIRR with the Nifty 50 over the same period
- Review sector allocation — are you more concentrated than you intended?
- Check weakest performers — is the original investment thesis still valid?
- Identify unrealised gains approaching 12 months — LTCG benefit kicks in right after that mark
When to Actually Act
| Situation | Right Response |
|---|---|
| Stock down 5% today, no news | Do nothing — almost certainly market noise ✓ |
| Stock down 20%, bad quarterly results | Revisit your investment thesis before deciding |
| Single stock now 40%+ of total portfolio | Consider rebalancing — concentration risk is real |
| XIRR below Nifty 50 for 2+ years consistently | Review stock selection or consider index funds |
| Unrealised gain approaching 12-month mark | Consider timing: LTCG at 12.5% vs STCG at 20% |
Advantages of Understanding Your Stock Portfolio
❌ Without Understanding
- React to every red Day’s P&L with panic
- Confuse paper losses for permanent losses
- Don’t know if your returns are good or just market movement
- Make sell decisions during temporary dips
- Miss tax optimisation around the 12-month mark
✅ With Understanding
- Know which numbers matter and which ones don’t
- Compare performance accurately against benchmarks
- Understand your actual sector exposure
- Make decisions based on fundamentals, not noise
- Plan sell timing to optimise LTCG vs STCG tax
Confidence in investing comes from understanding — not from predicting what the market will do next. Investors who understand their portfolio stay calmer during volatility and make fewer impulsive decisions. That calmness, compounded over years, is where real returns are built.
Limitations of Portfolio Numbers
Daily Numbers Don’t Represent Long-Term Performance
Markets fluctuate every session. A portfolio that falls today can recover next week. Judging your investment performance by one day’s movement is like judging a year’s rainfall by a single afternoon.
Past Returns Don’t Predict Future Results
Strong historical performance doesn’t guarantee similar results ahead. Stock prices are shaped by company earnings, economic conditions, interest rates, and investor sentiment — all of which change continuously. This article is for educational purposes only and does not constitute investment advice.
XIRR Is One Metric, Not the Complete Picture
XIRR is useful — but a complete portfolio review also needs risk level, diversification, investment goals, time horizon, and asset allocation. No single number captures all of that on its own.
Key Takeaways
- Invested Value — what you paid. Fixed until you buy or sell.
- Current Value — what your holdings are worth today. Changes every session.
- Day’s P&L — today only. Resets daily. Mostly noise for long-term investors.
- Total P&L — your actual overall gain or loss since you first invested.
- XIRR — best annual estimate for SIPs. Watch out for fresh capital inflating it short-term.
- Kite = quick daily snapshot. Console = deep analysis and tax reports.
- T1 = settlement pending. Auto-clears to regular holdings the next business day.
- Portfolio drops 50% overnight with no news? Check for a bonus/split ex-date. Corrects automatically in 2–4 days.
- Tax reality — STCG 20% (under 12 months) | LTCG 12.5% above ₹1.25L (over 12 months). Broker shows gross profit only.
- Compare your returns with Nifty 50 over the same period — that single comparison tells you more than any other metric.
- Green doesn’t mean spend-ready. Red doesn’t mean permanent loss.
Frequently Asked Questions
Why is my portfolio showing red when Nifty 50 is rising?
What is a good XIRR for a stock portfolio in India?
What does T1 mean in Groww or Zerodha?
Why did my stock drop 50% overnight with no bad news?
How much tax will I pay on stock profits in India?
What’s the difference between Day’s P&L and Total P&L?
What is the difference between realised and unrealised profit?
Conclusion
Learning how to read your stock portfolio in India is one of the first real skills every beginner builds after opening a demat account — and one of the most underrated.
The numbers on your screen — Invested Value, Current Value, Day’s P&L, Total P&L, XIRR — each answer a different question about your investments. Once you know what each one is actually measuring, your Groww or Zerodha portfolio stops feeling like a confusing dashboard and starts working like a clear, readable report.
Three things matter most over the long run: understand what you own and why, compare your XIRR against a benchmark every few months, and don’t let a red Day’s P&L push you into decisions that deserve a calmer moment. The investors who build real wealth aren’t the ones who react fastest — they’re the ones who understand what they’re looking at before they do anything.
Ready to go deeper? Start with understanding how the stock market works, explore the difference between NSE and BSE where your trades actually happen, and check what SEBI does to protect your investments as an Indian investor.
1 thought on “How to Read Your Stock Portfolio in India — Simple Groww & Zerodha Guide (2026)”