
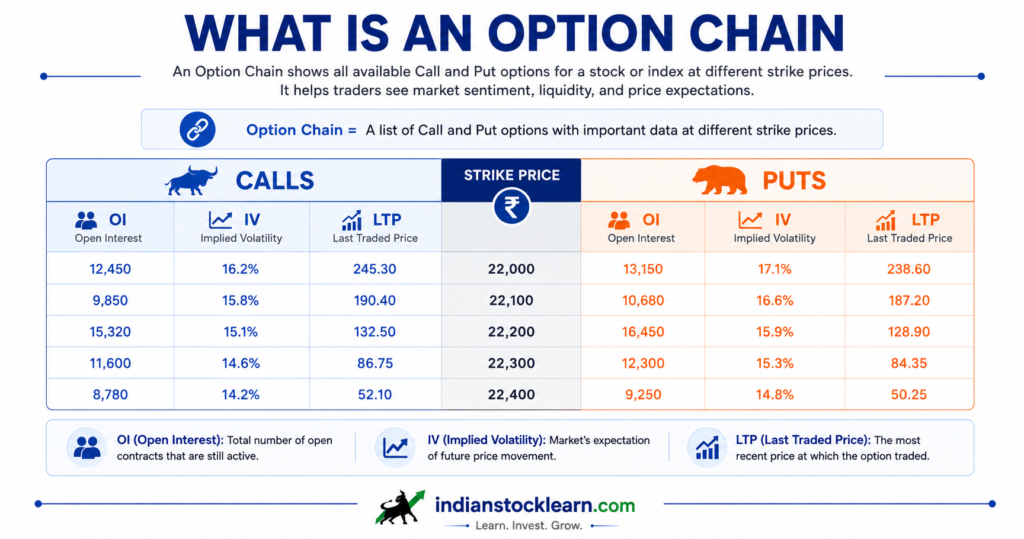
An option chain is a table showing every available Call and Put option for a stock or index, arranged by strike price and expiry. Open one on the NSE website for Nifty 50 or Reliance, and you’ll see columns like OI, LTP, IV, and Bid-Ask stacked on both sides of the strike price — confusing at first, manageable once you know what each column means.
This guide breaks the option chain down column by column, using simple Nifty 50 and Reliance examples. The goal is to help you read the table, not to suggest any trade — options carry real risk, and the numbers on this page are illustrations, not live market data.
What Is an Option Chain
An option chain is a table listing the available options contracts for an underlying asset — Nifty 50, Bank Nifty, or an individual F&O stock. Call options (CE) sit on one side, Put options (PE) on the other, with the strike price running down the centre.
A simplified Nifty option chain might look like this:
| Call Side (CE) | Strike Price | Put Side (PE) |
|---|---|---|
| Premium ₹180 | 24,800 | Premium ₹25 |
| Premium ₹145 | 24,900 | Premium ₹35 |
| Premium ₹110 | 25,000 | Premium ₹55 |
| Premium ₹82 | 25,100 | Premium ₹78 |
| Premium ₹60 | 25,200 | Premium ₹105 |
A Call option gives the buyer the right to buy the underlying at the strike price. A Put option gives the buyer the right to sell it at the strike price. Both a 25,000 CE and a 25,000 PE reference the same strike, but with opposite directional exposure — which is why the strike-price column sits at the centre of every chain.
How an Option Chain Works
Picture the option chain as a shelf of related products. The underlying is the product itself. The expiry tells you when the contract ends. The strike price is the agreed reference point, and the premium is what a buyer pays for that particular contract.
If Nifty trades at 25,000, the exchange lists strikes around it — 24,700, 24,800, 24,900, 25,000, 25,100, and so on. Strike intervals vary by underlying; NSE sets the step size based on factors including the volatility of that stock or index.
The same strike can carry a different price across expiries. A 25,000 Call expiring this week and a 25,000 Call expiring next month are different contracts — same strike, different time left for the underlying to move, which changes the premium.
How to Read Option Chain Columns
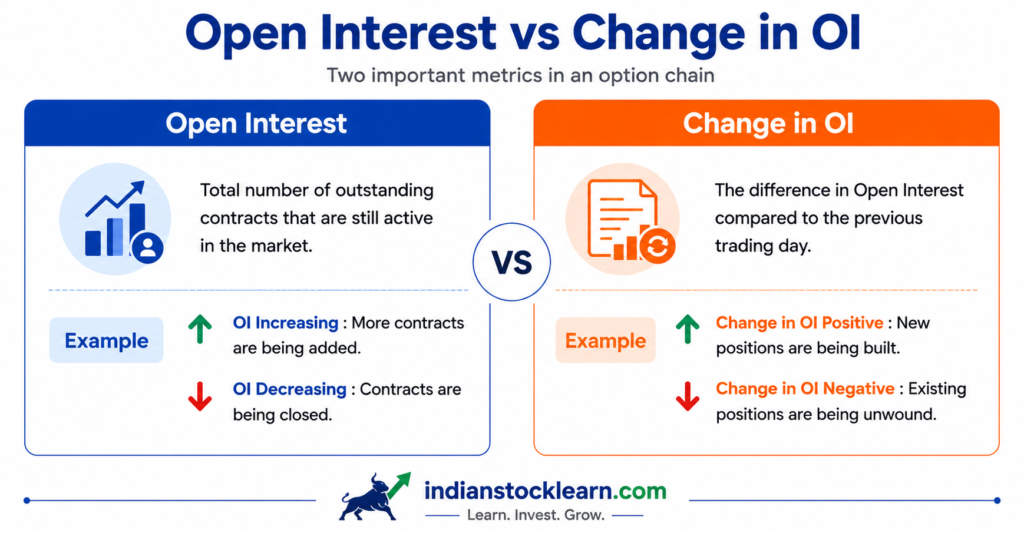
NSE’s option-chain screen places several columns on both sides of the strike price. Here’s what each one tells you.
Strike Price
The strike is the price fixed in the contract. “Nifty 25,000 CE” means the underlying is Nifty, the strike is 25,000, and it’s a Call. The matching Put is “Nifty 25,000 PE.”
LTP (Last Traded Price)
LTP shows the price of the most recent transaction for that contract — for example, a 25,000 CE with an LTP of ₹110. It’s not a guaranteed execution price; the live bid and ask can sit above or below it.
Bid and Ask Price
The bid is the highest price buyers are currently offering; the ask is the lowest price sellers want. A screen showing Bid ₹108 and Ask ₹112 has a bid-ask spread of ₹4. A wide spread makes execution less predictable than a tight one.
Volume
Volume counts how many contracts traded during the session. High volume signals active trading, but it’s a different number from open interest — don’t mix the two up.
Open Interest (OI)
OI is the number of outstanding contracts that remain open. A 25,000 CE showing OI of 1,20,000 means 1,20,000 contracts at that strike haven’t yet been closed or exercised. It’s one of the most watched numbers on the screen.
Change in OI
This shows how OI has moved since the previous session. If OI goes from 1,00,000 to 1,20,000, the change is +20,000. On its own, this number doesn’t tell you whether traders are bullish or bearish — it only shows that open positions increased.
Implied Volatility (IV)
IV reflects the market’s expectation of future volatility, priced into the option premium. A Call IV of 14% and Put IV of 15% simply means the market is pricing in slightly different volatility expectations on each side — a high IV isn’t automatically a bullish or bearish signal.
Formula and Concept Explanation
No single formula explains an entire option chain, but a few concepts tie the columns together.
Intrinsic Value
For a Call: Intrinsic Value = Spot Price − Strike Price. For a Put: Intrinsic Value = Strike Price − Spot Price. A negative result is treated as zero.
Example: Nifty spot at 25,100. A 25,000 CE has intrinsic value of ₹25,100 − ₹25,000 = ₹100. A 25,000 PE has intrinsic value of ₹25,000 − ₹25,100 = ₹0, since the result is negative.
Premium Beyond Intrinsic Value
If that same 25,000 CE trades at ₹140 while its intrinsic value is ₹100, the extra ₹40 reflects time value and other pricing factors. In short: Option Premium = Intrinsic Value + Time Value. As expiry gets closer, time value shrinks, which affects the premium.
ATM, ITM, and OTM
These describe moneyness. ATM (At the Money) means the strike sits close to the current spot price. ITM (In the Money) means a Call’s strike is below spot, or a Put’s strike is above spot. OTM (Out of the Money) is the reverse — a Call’s strike above spot, or a Put’s strike below spot. Once you can place a strike into one of these three buckets, the rest of the chain gets far easier to scan.
Reading It Step by Step
Don’t try to read every number on the screen at once. Work through it in order instead.
Real Nifty Option Chain Example
Suppose Nifty 50 trades close to 25,000. A simplified snapshot might look like this (illustration only, not live data):
| Call OI | Call LTP | Strike | Put LTP | Put OI |
|---|---|---|---|---|
| 1,50,000 | ₹190 | 24,800 | ₹35 | 80,000 |
| 2,20,000 | ₹145 | 24,900 | ₹48 | 1,05,000 |
| 2,80,000 | ₹105 | 25,000 | ₹72 | 1,90,000 |
| 2,60,000 | ₹73 | 25,100 | ₹105 | 2,25,000 |
| 2,10,000 | ₹50 | 25,200 | ₹145 | 1,80,000 |
Start with where Nifty is actually trading, then compare OI across nearby strikes, then compare Call and Put premiums at each row. A large OI number at one strike, on its own, doesn’t tell you what the market will do next — it’s one data point among several, not a prediction.
Open Interest vs Change in Open Interest
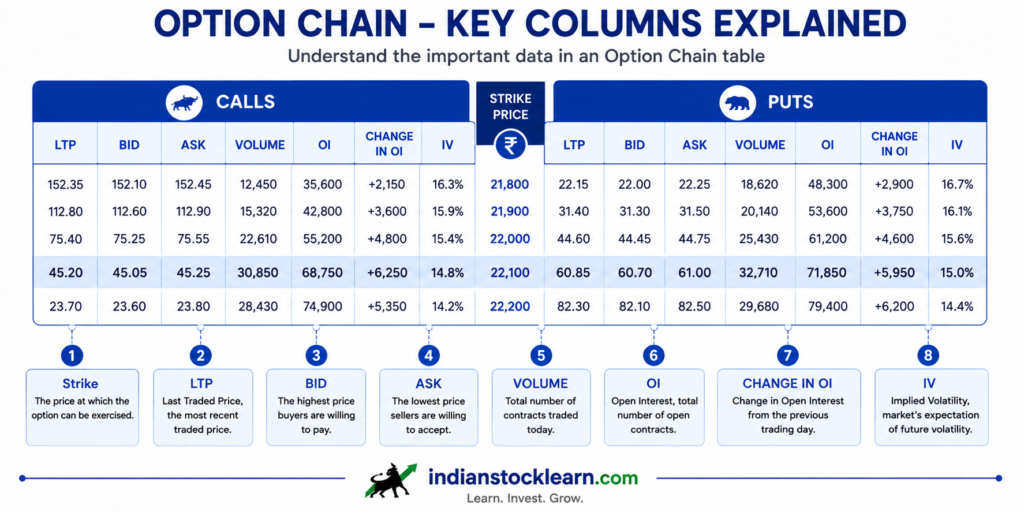
This is where beginners mix things up most often. If OI moves from 1,00,000 to 1,30,000, Change in OI is +30,000 — more contracts are open than before. If OI falls from 1,30,000 to 90,000, Change in OI is −40,000 — outstanding contracts have shrunk.
Myth vs Reality: Option Chain Rules That Sound Right but Aren’t
A handful of “rules” get repeated so often on Telegram and YouTube that beginners treat them as facts. Most are half-true at best.
| Myth | Reality |
|---|---|
| “High OI at a strike is a guaranteed support or resistance level.” | OI shows how many contracts are open, not who holds them or why. Institutions, hedgers, and retail traders all add to the same number for different reasons. |
| “Rising OI always tells you the market is turning bullish or bearish.” | Rising OI just means more contracts got opened. Whether that’s fresh buying or fresh selling isn’t visible from OI alone — you need price and volume alongside it. |
| “High volume means the option is easy to trade at that price.” | Volume measures how much has traded already, not what’s tradeable right now. The bid-ask spread is what tells you if you can actually get in or out at a fair price. |
| “The strike with the highest total OI is the day’s key level.” | It’s often just the most-traded strike, not necessarily the one that decides where price goes. Context — expiry, nearby strikes, and how OI is moving — matters more than the raw number. |
| “LTP is the price you’ll get if you place an order.” | LTP is only the last traded price, which could be minutes old. Your actual execution price depends on the current bid and ask. |
None of these shortcuts are useless — they’re just starting observations, not rules. Read them alongside price action and the bid-ask spread instead of trusting any single column in isolation.
Why Traders Use an Option Chain
An option chain pulls a large amount of derivatives data onto one screen. Market participants use it to compare strike-wise activity, check pricing across strikes and expiries, gauge liquidity through bid-ask and volume, read the volatility priced into IV, and quickly sort contracts by moneyness (ITM, ATM, OTM).
Advantages
- All key data in one place: strike, premium, OI, volume, and IV sit together instead of across multiple screens.
- Easy strike comparison: move from one strike to the next and see how premiums and OI shift.
- A window into market structure: the chain shows where derivatives activity is concentrated.
- Useful for learning options: it connects textbook terms — strike, premium, moneyness — to live market data.
- Available directly from the exchange: NSE’s option-chain interface includes downloadable data for every listed contract.
Limitations & Common Mistakes
An option chain packs in a lot of data, but none of it comes with certainty attached.
- An option chain lists Call (CE) and Put (PE) contracts by strike price and expiry, side by side.
- Strike price is the central reference point connecting both sides of the chain.
- OI shows outstanding open contracts; Change in OI shows how that figure moved — the two aren’t interchangeable.
- IV reflects volatility priced into the option, not a directional signal by itself.
- Reading Calls and Puts together, across several columns, beats reading any single number in isolation.
- Popular “rules” (high OI = resistance, high volume = easy execution) are starting observations, not guarantees.
- Over 91% of individual F&O traders lost money in FY25 per SEBI — treat option chain reading as education, not a trading edge.
Frequently Asked Questions
What is an option chain?
How do I read option chain data?
What does OI mean in an option chain?
What’s the difference between OI and Change in OI?
Does high Call OI mean resistance?
Can beginners understand an option chain?
Where can I check a live option chain?
Conclusion
An option chain stops looking like a wall of numbers once you know what each column is actually answering. Strike price tells you where a contract sits, LTP shows the last traded price, OI shows outstanding contracts, and IV reflects the volatility priced into the premium. Read the columns together, not one at a time.
Before opening a live option chain for the first time, make sure you’re solid on what Nifty 50 and Bank Nifty actually track and how the stock market itself works — the chain will make far more sense once those basics are in place.
1 thought on “What Is an Option Chain? How to Read It (India Guide)”