

This guide picks up where a beginner explanation of the option chain leaves off. If you already know what strike price, LTP, OI, and IV mean individually, this covers what happens when you read them together — option chain analysis at the level where price, open interest, and volatility start telling a more complete story than any single column can.
None of this is a signal to trade on. It’s a set of concepts institutional desks use to interpret the same public data retail traders see — with the honest caveats about where each one breaks down.
What This Guide Assumes
This piece assumes you’re comfortable with strike price, CE/PE, LTP, bid-ask, volume, OI, Change in OI, IV, and moneyness (ITM/ATM/OTM). If any of those feel shaky, start with our beginner option chain guide first — the concepts here build directly on it.
The OI Buildup Framework
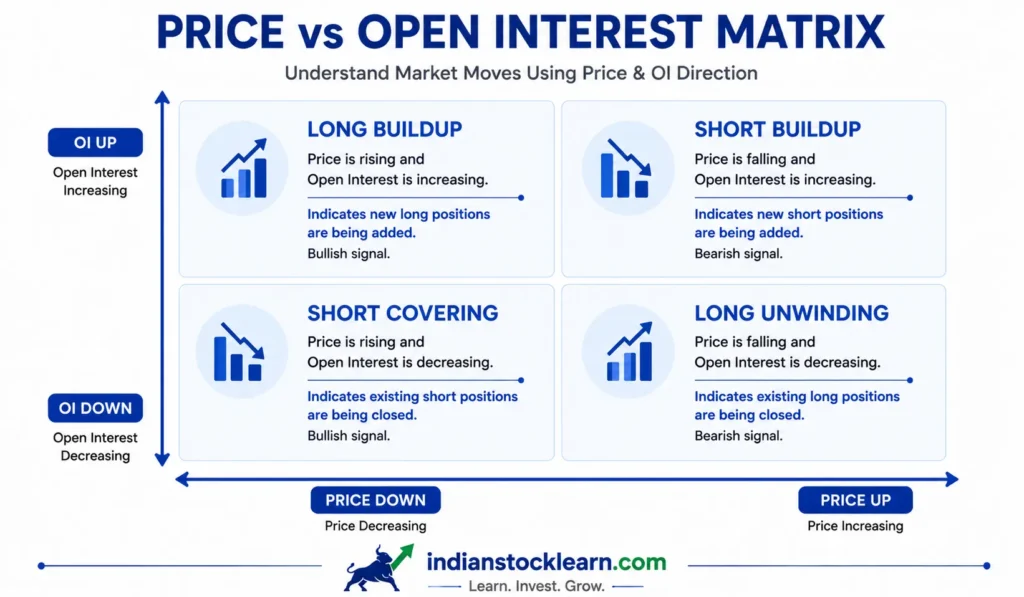
Reading price and OI together, rather than OI alone, gives you four broad states. None of them is proof of anything — they’re a vocabulary for describing what’s visible on the chain.
| State | Price | OI | What It Suggests |
|---|---|---|---|
| Long Buildup | Up | Up | New positions opening alongside rising price — consistent with fresh buying interest. |
| Short Buildup | Down or flat | Up | New positions opening while price stalls or falls — consistent with fresh selling or writing. |
| Short Covering | Up | Down | Positions closing as price rises — consistent with sellers buying back to exit. |
| Long Unwinding | Down | Down | Positions closing as price falls — consistent with buyers booking out. |
Why OI Alone Can Mislead You
Every option contract has a buyer and a seller by definition — OI counts the contract, not the conviction behind it. A rising OI number tells you positions were opened. It doesn’t tell you whether the buyer was aggressive or the seller was aggressive, since both sides exist for every single contract.
This is why combining OI direction with price direction and premium movement gives more information than OI alone — and why even a “clean” long-buildup or short-buildup reading is an interpretive clue, not proof. Two identical +20,000 OI changes at the same strike, on different days, can reflect completely different underlying activity depending on what price and IV were doing at the same time.
Market Makers and Why ATM OI Is Naturally High
A meaningful share of the OI sitting at or near the current price isn’t a directional bet at all. Market makers and arbitrage desks run strategies — conversion and reversal trades, for instance — that combine a stock position with an offsetting call and put. These add OI to both the CE and PE side of a strike while leaving the desk close to directionally neutral.
This connects to a broader idea called delta hedging: a market maker who sells you an option typically hedges that risk by trading the underlying or futures, adjusting the hedge as price moves. That hedging activity is a mechanical response to risk, not a market opinion — but it still shows up in the option chain as OI and can still influence price near heavily-hedged strikes. It’s one reason ATM strikes structurally carry more OI than far OTM ones, independent of what retail sentiment is doing.
IV Skew and Cross-Expiry Comparison
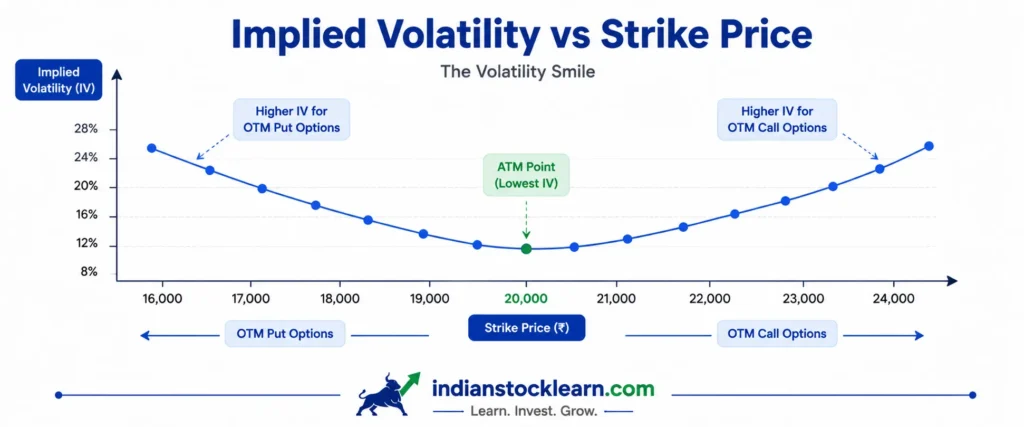
Treating IV as one single number for the whole chain is a common beginner shortcut. In practice, IV varies across strikes for the same expiry — a pattern usually called skew. A simplified, illustrative example:
| Strike | Call IV | Put IV |
|---|---|---|
| 24,800 | 14.2% | 17.1% |
| 24,900 | 14.0% | 16.3% |
| 25,000 (ATM) | 13.8% | 15.2% |
| 25,100 | 14.1% | 14.8% |
| 25,200 | 14.7% | 14.5% |
Two options on the same underlying and expiry can carry noticeably different IV depending on strike — that’s the skew. It’s model-derived, reflecting how the market is pricing risk at each strike, not a direct measurement of where price will actually go.
The same logic applies across expiries. A 25,000 CE on this week’s expiry and the same strike a month out are different contracts with different IV and premium behaviour, even though the strike is identical. Comparing them without normalising for time remaining is a common way beginners misread cross-expiry data — before major events (Union Budget, RBI policy, election results), it’s normal for IV on both calls and puts to rise together, since the market is pricing in gap risk in either direction, not just one side.
ADD IMAGE: iv-skew-comparison-india-2026
The Liquidity Trap
High daily volume on a contract doesn’t guarantee you can trade it easily right now. Two things worth checking before trusting a quote:
LTP Can Be Stale
If the last trade on a contract happened several minutes ago and the underlying has since moved, the LTP no longer reflects current conditions. It’s a historical data point, not a live quote.
Spread Width Over Headline Volume
A contract showing heavy volume can still have a wide bid-ask spread if most of that volume happened earlier, or if depth beyond the best bid/ask is thin. A ₹2 spread on a ₹25 premium is a meaningfully larger cost than the same ₹2 spread on a ₹200 premium — check the spread as a share of the premium, not just its absolute size. This shows up most in far OTM options and mid-cap stock options, where volume can look active while the order book is genuinely thin.
Expiry Day: When the Rules Change
Option chain data behaves differently on expiry day, and a few mechanics are worth knowing before you interpret it the same way you would mid-week.
Physical Settlement
Since SEBI mandated physical settlement for stock options, an in-the-money stock option left open at expiry results in actual delivery of shares rather than a cash settlement. This changes how OI behaves into expiry — many traders close ITM stock option positions before expiry specifically to avoid the delivery and margin obligations that come with it, which can make OI decay look more dramatic than a simple shift in sentiment would suggest. Index options like Nifty and Bank Nifty remain cash-settled.
The Tax Trap on Exercised Options
If you let an in-the-money option run into expiry instead of squaring it off, Securities Transaction Tax gets charged on the contract’s full settlement value rather than only your profit — for a deep ITM position, this can occasionally be a meaningful cost relative to the gain. STT rates on options have changed more than once in recent years, so rather than quote a figure that may be outdated by the time you read this, check your broker’s current charges page before expiry and square off ITM positions you don’t intend to hold into settlement.
The Final-Hour Square-Off
Most brokers run automated risk-management square-offs on client positions in the last part of the trading session on expiry day to manage settlement risk. Volume and OI drops late in the day can reflect this automated process rather than a shift in market direction.
A Note on “Max Pain”
Max Pain — the strike where option writers as a group would owe the least payout — comes up constantly in option chain discussions, so it’s worth addressing directly rather than pretending it doesn’t exist. The honest answer is that practitioners disagree on how useful it is.
It’s calculated from a snapshot of current OI, which means it can shift meaningfully as OI changes through the day, particularly on weekly expiries where positioning is thinner. Some traders find it a weak reference point in quiet, range-bound weeks; in weeks with major news or strong directional flow, it’s frequently overridden entirely. Given that disagreement and the fast-changing nature of the underlying data, it isn’t something we’d recommend leaning on as a standalone tool — if you come across it elsewhere, treat it as one unreliable data point among many, not a target.
- Long buildup, short buildup, short covering, and long unwinding describe price-OI patterns — they’re vocabulary, not proof of intent.
- A large share of OI near the current price reflects market-maker hedging, not directional bets.
- IV varies across strikes (skew) and across expiries — treating it as one number misses most of the picture.
- High volume doesn’t guarantee easy execution — check the bid-ask spread relative to the premium.
- Expiry day changes the mechanics: physical settlement, exercise-related tax, and broker square-offs all distort the chain in the final hours.
- Max Pain is contested among practitioners — treat it as one weak data point, not a forecast.
Frequently Asked Questions
What is long buildup vs short buildup in option chain analysis?
Does high OI always mean support or resistance?
What is IV skew?
Why does physical settlement matter for stock options?
Is Max Pain a reliable prediction of where Nifty will expire?
Why does a high-volume option sometimes have a wide bid-ask spread?
Where should I start if this feels too advanced?
Conclusion
Real option chain analysis is less about memorising one column and more about reading price, OI, and IV together, and knowing exactly where each interpretation breaks down. The four buildup states give you a vocabulary, IV skew tells you volatility isn’t one number, and expiry-day mechanics remind you that the same columns mean something different once settlement rules kick in.
None of this replaces understanding how the stock market works at a fundamental level, or knowing what Nifty 50 and Bank Nifty actually represent before you look at their derivatives.