
Open interest (OI) is a term you’ll see on every futures and options screen, right next to volume. Understanding open interest vs volume is one of the first things worth sorting out before F&O data on any app starts making sense.
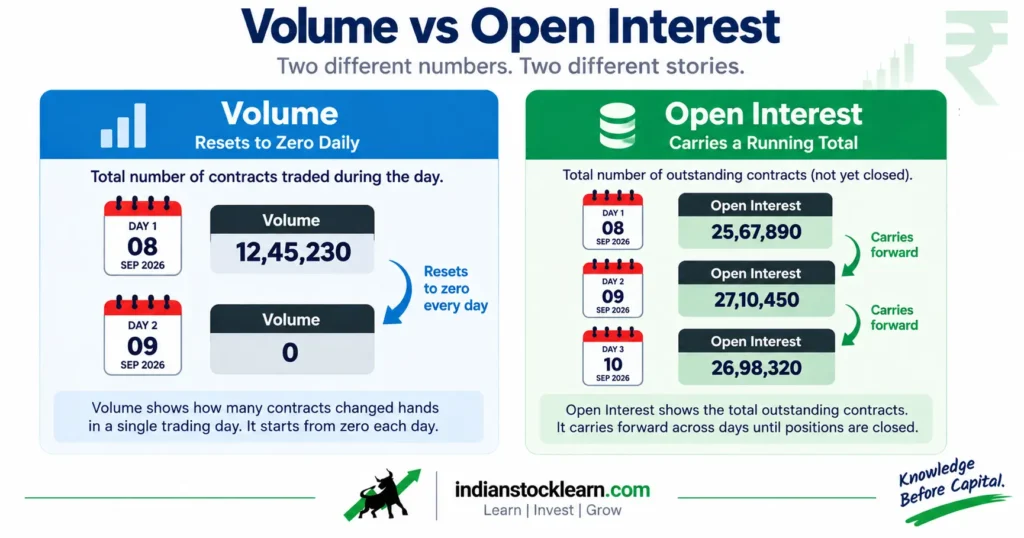
Open interest counts how many contracts are currently open – bought and sold but not yet closed. Volume simply counts how many trades happened that day. They look similar at a glance but measure completely different things, and mixing them up is one of the most common beginner confusions in derivatives.
This guide covers what OI actually means, how it rises and falls, the formula behind it, and examples using Nifty 50, Reliance and TCS futures.
What Is Open Interest (OI)?
Open interest is the total number of outstanding futures or options contracts that haven’t been settled or closed. It shows how many active positions exist for a particular contract at a given time. If 10 traders each buy or sell one Nifty 50 futures contract, and none of those contracts have been closed, the open interest is 10.
OI vs Volume
| Feature | Open Interest (OI) | Volume |
|---|---|---|
| What it counts | Contracts currently open (unsettled) | Trades executed in one day |
| Resets daily? | No – carries over | Yes – resets each session |
| Rises when | New positions are created | Any trade happens |
| Falls when | Existing positions are closed | Never – it only accumulates within the day |
| Stays the same when | A position is transferred between traders | Not applicable – a transfer still counts as a trade |
How It Works
How It Works
Every futures or options contract involves a buyer (long) and a seller (short). Each new contract adds one long and one short to the market. Open interest counts those unmatched, currently open positions.
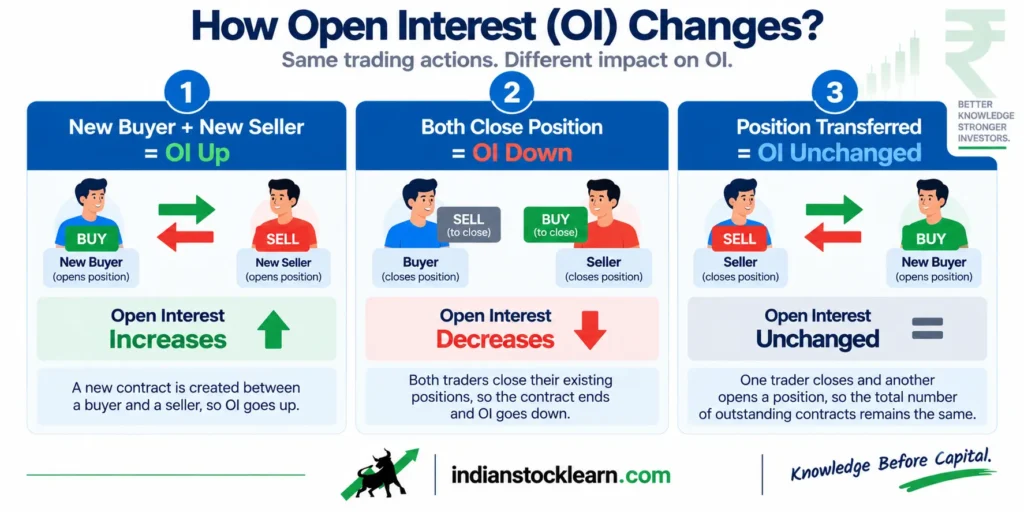
A new buyer and a new seller create a contract that didn’t exist before – fresh money entering that contract.
An existing long and an existing short close their positions with each other – money leaving that contract.
A trader exits by selling to someone else entering fresh – the position is transferred, not created or closed.
Exchanges report the change in open interest for each futures and options series daily. NSE shows OI and OI change for index futures, stock futures and options. A rise in OI usually means more new positions opened than closed; a fall means more positions closed than opened.
Formula or Concept Explanation
There’s no complex math behind open interest – it’s a running count.
Open Interest Today = Open Interest Yesterday + New Contracts Opened − Contracts Closed
Worked example: yesterday’s OI was 100,000 contracts. Today, traders opened 20,000 new contracts, taking OI to 120,000. On the same day, 5,000 existing positions closed, bringing OI down to 115,000. That’s the number of contracts still open at the end of the day.
Real Stock Market Example
Here’s how this plays out across three instruments of different sizes:
| Instrument | Yesterday’s OI | New Contracts | Closed | Today’s OI |
|---|---|---|---|---|
| Nifty 50 futures | 1,50,00,000 | 2,00,000 | 50,000 | 1,51,50,000 |
| Reliance futures | 2,00,000 | 10,000 | 2,000 | 2,08,000 |
| TCS futures | 50,000 | 5,000 | 1,000 | 54,000 |
These figures are illustrative, not live market data. In practice, you’d check the NSE website or your trading app for “Change in OI” next to each contract. Large, liquid instruments like Nifty futures typically show OI in crores; individual stock futures usually show OI in lakhs or thousands. A sharp rise or fall in a stock’s futures OI often lines up with news or events, like an earnings announcement.

Why Traders Use It
Traders check open interest mainly to gauge market participation in a contract. High OI generally means more participants, which usually translates to better liquidity – tighter spreads and easier entry and exit.
Some also look at how price moves relative to OI. If price is rising and OI is rising too, it suggests new positions are backing the move. If price is rising but OI is falling, some traders read that as short-covering rather than fresh buying – though this is a pattern to be aware of, not a rule that always holds. Near expiry, OI naturally collapses as contracts settle, which is a normal part of the options and futures cycle.
OI also naturally drops as a contract approaches its expiry, since contracts settle and close out. A trader who sees OI fall sharply in expiry week is often watching normal settlement, not a wave of traders losing confidence.
Advantages of Open Interest
What OI Tells You
- Overall level of market participation in a contract
- A rough liquidity gauge – higher OI usually means easier entry and exit
- One input for reading trend strength alongside price and volume
- Widely published by NSE and most broker apps
What OI Can’t Tell You
- Which direction the price will move next
- Real-time intraday shifts – it’s typically updated after market close
- Anything about the cash market, since only F&O contracts have OI
- Reliable signals in thin, less-traded contracts
Limitations of Open Interest
OI is not a standalone predictor of price direction – very high OI just means many positions are open, not that prices will move a certain way. It’s usually updated at the end of the trading day, so it doesn’t reflect the very latest intraday activity. Every futures and options series also has a fixed expiry, and OI in that series naturally drops to zero as contracts settle – a normal reset that can confuse beginners who expect OI to keep climbing indefinitely.
In thinly traded contracts, a small number of large positions can push OI up or down in a way that doesn’t reflect broad participation, so OI readings on illiquid contracts deserve extra caution.
One practical mix-up worth avoiding: some platforms display OI as a number of contracts, while others show it as total quantity (contracts multiplied by lot size). Comparing OI across two apps without checking which unit each one uses can make numbers look inconsistent when they aren’t.
- Open interest counts active, unsettled futures or options contracts – it doesn’t count trades.
- Volume counts trades per day and resets daily; OI carries over until a position closes.
- Rising OI means new positions are being added; falling OI means positions are being closed.
- A position transferred between two traders doesn’t change OI, even though it adds to volume.
- Every contract needs a buyer and a seller, so rising OI alone doesn’t reveal which side is more confident – or whether it’s hedging rather than speculation.
- OI falling sharply near expiry is usually normal settlement, not a sentiment signal.
- Stocks can hit an exchange-set OI ceiling (MWPL) and enter an “F&O ban,” where only existing positions can be closed.
- High OI usually signals better liquidity, but it doesn’t predict price direction on its own.
- OI is exclusive to derivatives – the cash market for shares doesn’t have open interest.
- F&O trading carries substantial risk; most individual traders in this segment have historically lost money.
Frequently Asked Questions
What does open interest mean?
What’s the core difference in open interest vs volume?
When does open interest increase or decrease?
Is higher open interest always better?
Can open interest predict price direction?
Where can I check open interest data?
Does open interest affect the underlying stock’s price directly?
Conclusion
Open interest vs volume comes down to one distinction: volume counts trades in a day and resets every session, while open interest counts active positions and carries over until they’re closed. Rising OI signals new positions entering a contract; falling OI signals positions being closed out.
Reading OI alongside price and volume – for Nifty, Reliance, TCS or any other F&O instrument – gives a fuller picture of market participation than any of the three numbers alone. It’s one piece of context, not a signal to act on by itself.