
This is the advanced companion to our beginner’s guide to expense ratio in mutual funds. If you’re new to the topic, start there – it covers what expense ratio is, the formula, and the 2026 SEBI update that splits TER into Base Expense Ratio, brokerage costs and statutory levies.
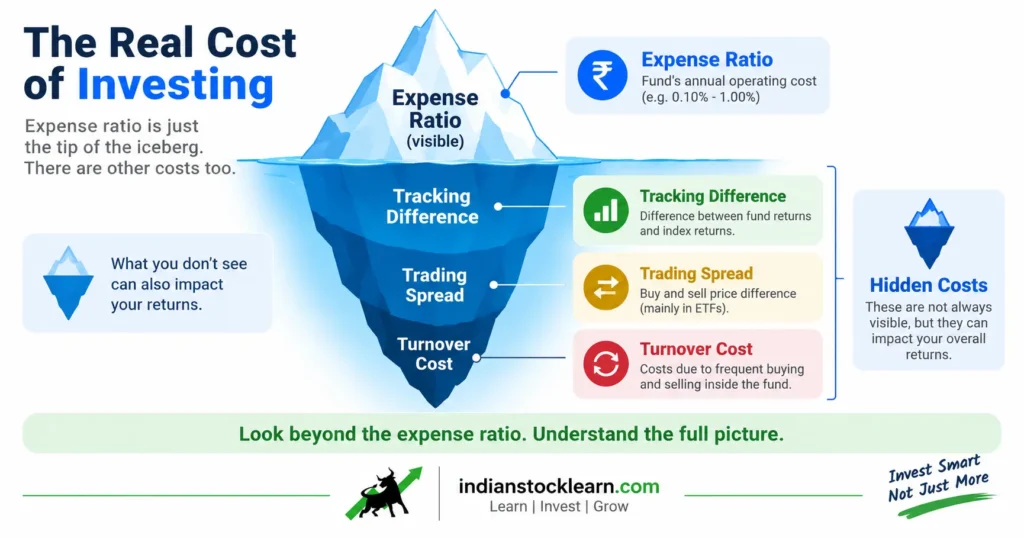
This guide goes further. Understanding the total cost of mutual fund investing means looking past the headline expense ratio to tracking difference, trading costs, and plan-choice trade-offs that the published TER doesn’t fully capture.
Why Expense Ratio Isn’t the Whole Story
Since April 2026, SEBI requires every fund to show its Total Expense Ratio (TER) broken into three parts: the Base Expense Ratio (the fund house’s own management fee), brokerage and transaction costs the fund incurs while trading its portfolio, and statutory levies like GST and STT. That’s a meaningful transparency upgrade – but even the full TER still isn’t everything that affects your net return.
That last point is where most comparisons go wrong, and it’s the subject of the next section.
Expense Ratio vs Tracking Difference
For an index fund or ETF, expense ratio is only an input to performance, not the final answer. What actually matters to you is tracking difference – the real, measured gap between the fund’s return and its benchmark’s return over a period.
| Term | What It Measures |
|---|---|
| Expense Ratio (TER) | What the fund charges you, as disclosed on the factsheet |
| Tracking Difference | The actual annualised gap between the fund’s return and its benchmark’s return |
| Tracking Error | How much that gap’s size varies day to day (its volatility), not its average size |
Two funds tracking the same index can end up with different tracking differences even with similar TERs, because of factors like cash held for redemptions, how closely the fund replicates every constituent, and the timing of dividend reinvestment. A fund with a 0.15% TER but a wider tracking difference can lag its benchmark by more than a fund charging 0.20% with tighter tracking.
Instead of stopping at the listed expense ratio, check the fund’s 1-year and 3-year return against its own benchmark (not the price index quoted in the news – use the Total Return Index figure, since that includes dividends). That gap is closer to your real cost than the TER alone.
We cover the related distinction between the Nifty 50’s Total Return Index and Price Return Index in more depth in our index fund guide, if you want the fuller explanation.
ETF vs Index Fund: The Total Cost Comparison
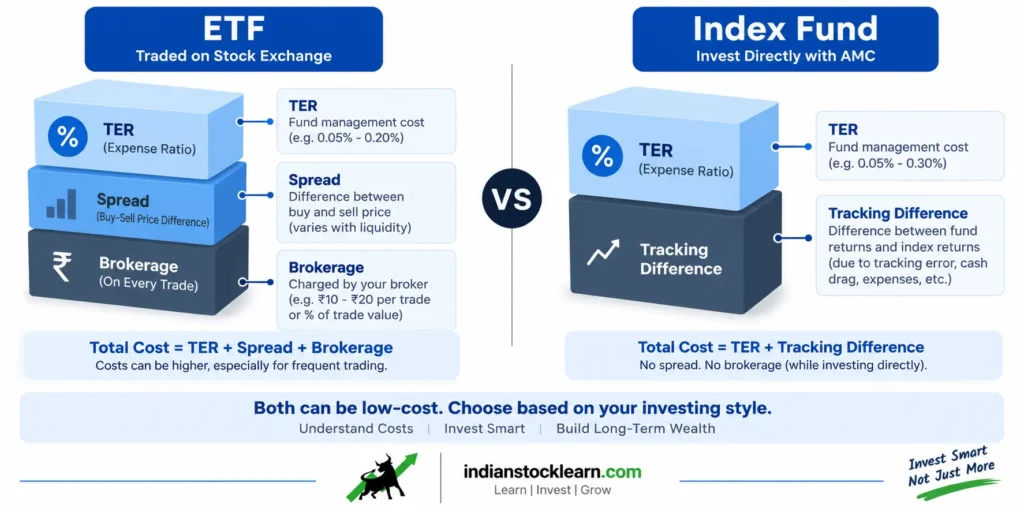
ETFs typically advertise lower expense ratios than index mutual funds tracking the same benchmark. On TER alone, the ETF usually wins. On total cost, the answer depends on how you actually buy and hold it.
ETF’s Full Cost Stack
- Expense ratio (often the lowest on paper)
- Bid-ask spread on every purchase and sale
- Possible premium or discount to the fund’s actual (iNAV) value
- Brokerage on each transaction, and a demat account
Index Fund’s Full Cost Stack
- Expense ratio (typically slightly higher than the equivalent ETF)
- Tracking difference
- No demat account or per-trade brokerage required
- True SIP auto-debit, without needing to place a market order
For a small, regular monthly investment, the ETF’s spread and brokerage can add up to more than the TER gap it was supposed to save. For a large, infrequent lump-sum purchase in a highly liquid ETF, the spread matters much less. There’s no universal winner – it depends on investment size, frequency and the specific ETF’s liquidity.
ADD IMAGE: etf-vs-index-fund-total-cost-india-2026
The Double-Layer Cost in Fund-of-Funds
Fund-of-funds (FoFs) – including many that give Indian investors access to international markets – add a structural wrinkle. When an Indian AMC runs a fund that itself invests in another fund (say, a US index fund), you’re typically exposed to two expense ratios stacked together: the Indian FoF’s own fee, and the underlying fund’s fee.
Direct vs Regular Plans: Beyond “Direct Always Wins”
The standard advice is straightforward: direct plans skip the distributor commission built into regular plans, so direct is mathematically cheaper. That’s true as far as the expense ratio goes. It’s not the entire picture of what a distributor’s commission is meant to pay for.
| Factor | Direct Plan (DIY) | Regular Plan (Distributor-Assisted) |
|---|---|---|
| Expense ratio | Lower | Higher (includes distributor commission) |
| Rebalancing discipline | Your own responsibility | Often handled or prompted by the distributor |
| Behavioural support during a crash | None built in | A distributor may discourage panic-selling |
| Best suited for | Investors comfortable managing their own portfolio | Investors who value ongoing guidance and coordination |
None of this means a regular plan is automatically worth its extra cost, or that a direct-plan investor is guaranteed to manage their own portfolio well. It means the expense-ratio gap between the two isn’t the only variable – your own consistency, discipline and willingness to review your portfolio matter too. That’s a personal fit question, not a pure math question, and this article isn’t the place to answer it for you.
A Practical Cost-Check Workflow
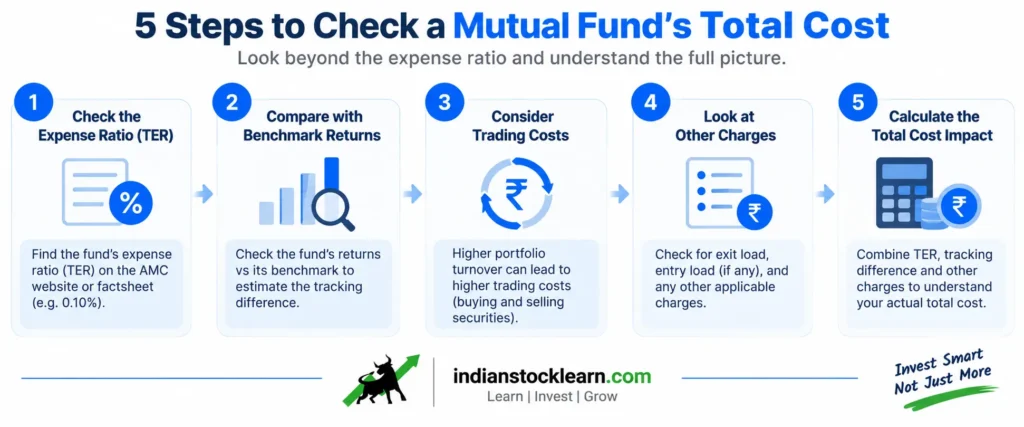
Instead of checking a fund’s expense ratio once at purchase and forgetting about it, a repeatable annual check covers more of the real picture.
Check the latest factsheet for the Base Expense Ratio, brokerage/transaction cost, and statutory levy components.
For index funds and ETFs, check the fund’s return against its benchmark’s Total Return Index, not just the price index.
A fund near a SEBI AUM slab boundary or shrinking sharply can see its TER shift; a very small or declining fund can also carry viability risk.
Look at typical daily trading volume and the bid-ask spread before assuming the lowest TER option is the cheapest to actually trade.
- Expense ratio is the disclosed fee – it isn’t the total cost of owning a fund.
- For index funds and ETFs, tracking difference (measured against the Total Return Index) matters more than the TER alone.
- ETFs often show a lower TER than index funds, but spread and brokerage can offset that for small, frequent investors.
- Fund-of-funds can carry two layers of expense ratio – the Indian FoF’s own fee plus the underlying fund’s fee.
- Direct plans are cheaper on paper, but the distributor commission in a regular plan is meant to pay for guidance and coordination, not just distribution.
- A fund’s cost profile is worth re-checking annually, not just at the time of purchase.
Frequently Asked Questions
What is the total cost of mutual fund investing, beyond the expense ratio?
Is tracking difference the same as tracking error?
Is an ETF always cheaper than an index fund tracking the same index?
Why do some fund-of-funds have two expense ratios?
Should I always choose a direct plan over a regular plan?
How often should I re-check a fund’s cost profile?
Conclusion
The total cost of mutual fund investing is bigger than the number on a factsheet. Expense ratio, tracking difference, trading costs and plan choice all combine to determine what you actually keep – and the cheapest-looking option on any single metric isn’t always the cheapest in practice.
None of this replaces the basics – expense ratio is still the right place to start. This guide is for going one layer deeper once you’ve got that foundation, whether you’re comparing two Nifty 50 funds, weighing an ETF against an index fund, or deciding between a direct and regular plan.