
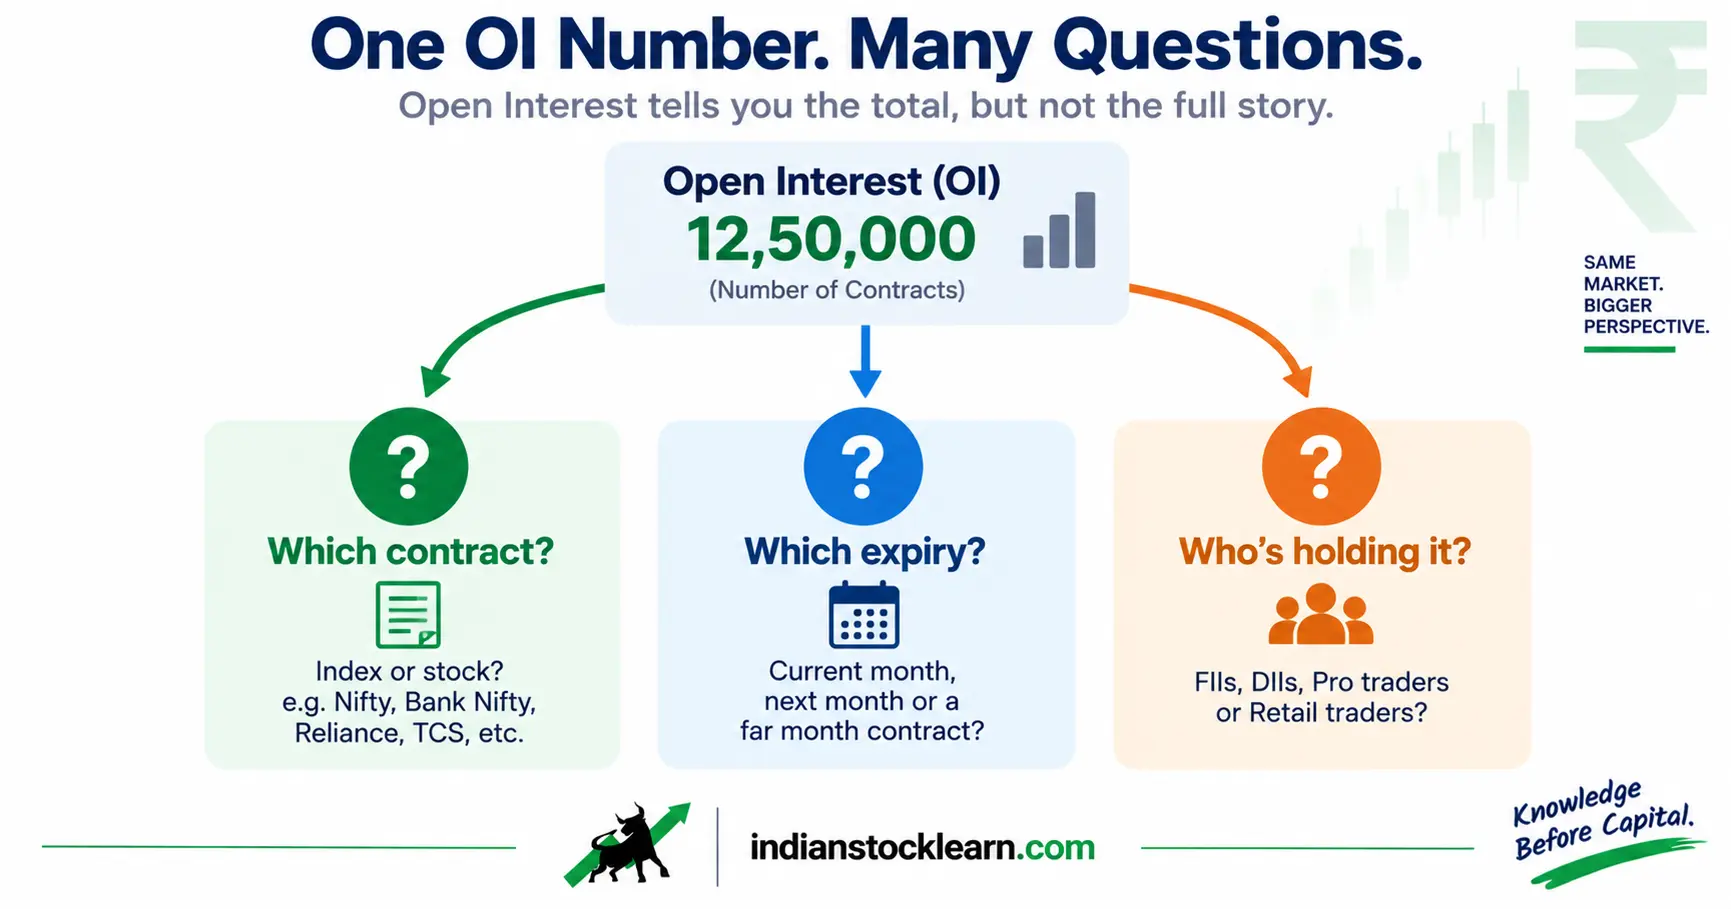
This is the advanced companion to our beginner’s guide to open interest vs volume. If you’re new to OI, start there – it covers the core definition, how OI rises and falls, and the formula behind it.
This open interest advanced guide goes further into how OI actually behaves in practice: how it migrates between expiry months, why futures OI and options OI aren’t the same kind of data, what NSE’s participant-wise OI reports show, and the specific situations where an OI reading can mislead even an experienced reader.
The Rollover Mechanics: How OI Migrates
Every futures and options series has a fixed expiry, and OI in that series has to reach zero as contracts settle. What a simple OI chart doesn’t show is that many of those positions don’t disappear – they migrate to the next contract month, a process traders call “rolling over.”
A trader holds a futures or options position in the contract expiring this month.
As expiry approaches, the trader closes the near-month position – near-month OI falls.
The same trader opens an equivalent position in next month’s contract – next-month OI rises.
Looking at only the near-month OI chart makes it look like the position vanished. Looking at both months shows it simply moved.
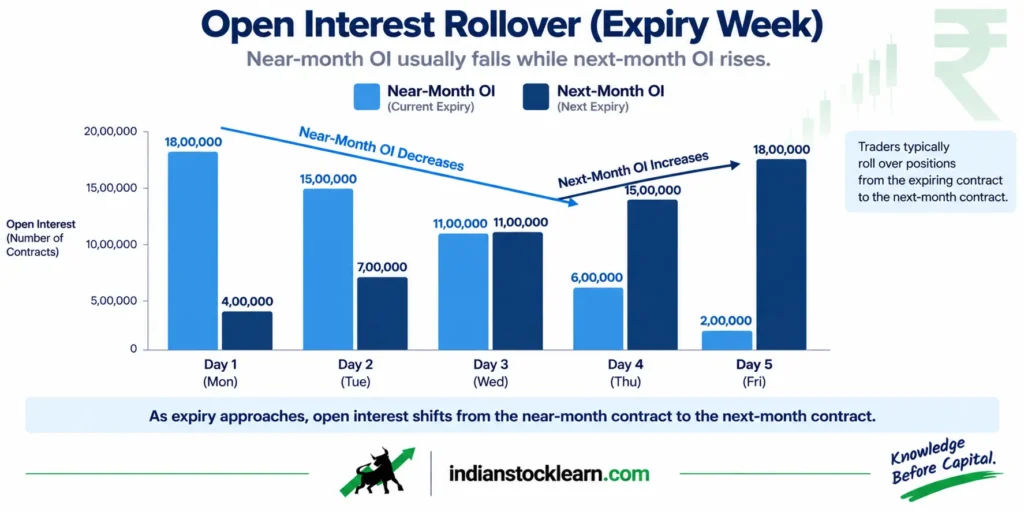
This is often described using a “rollover percentage” – roughly, how much of the expiring month’s OI reappears in the next month. There’s no single universally agreed threshold for what counts as a “high” or “low” rollover, and specific cutoffs circulating online vary by source, so treat any exact percentage rule you see elsewhere with some caution. The more reliable habit is simply checking both the near-month and next-month OI together during expiry week, instead of reading the near-month chart in isolation.
Futures OI vs Options OI
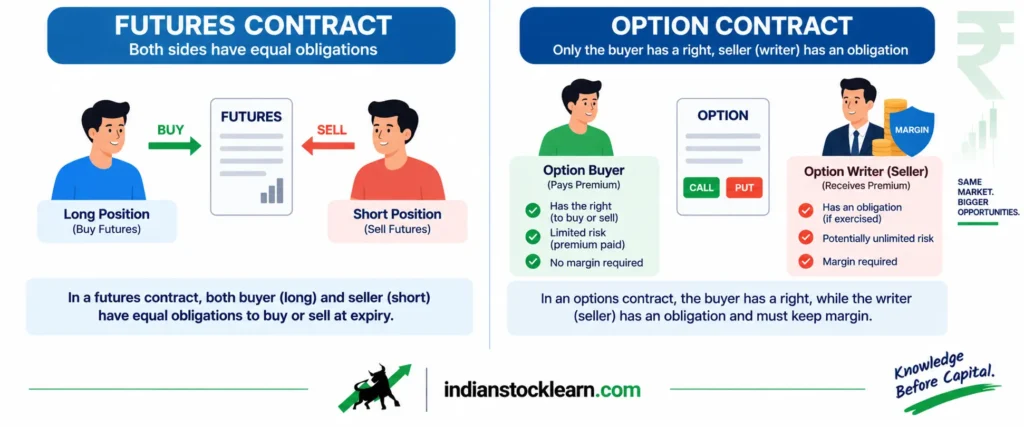
Both futures and options report “open interest,” but the number represents a different kind of positioning in each case.
| Dimension | Futures OI | Options OI |
|---|---|---|
| Structure | Symmetrical – one long, one short, similar risk profile | Asymmetrical – a buyer with limited risk, a writer (seller) with a margin obligation |
| Who typically dominates OI | A broader mix of directional and hedging positions | Often heavily influenced by option writers, including funds writing covered calls against existing holdings |
| Settlement (stock derivatives) | Cash-settled based on final price | Since October 2019, NSE has physically settled in-the-money stock options and futures at expiry, meaning actual shares can change hands |
| Index vs stock options | Not applicable | Index options are cash-settled; stock options can involve physical delivery at expiry |
One practical implication: a large call OI at a stock’s option strikes doesn’t automatically mean traders are bearish and “writing resistance.” It can also reflect a fund holding the underlying shares and selling calls against them for income – a different motivation entirely, with a different effect on how that position behaves as expiry nears.
Participant-Wise OI: Who’s Actually Holding It
The OI number on a broker app is an aggregate – it doesn’t say who holds the long side and who holds the short side. NSE separately publishes participant-wise data that breaks down open interest and trading activity by category: Foreign Portfolio Investors (FPIs), Domestic Institutional Investors (DIIs), proprietary trading desks, and individual clients.
| Participant Category | What Their OI Often Reflects |
|---|---|
| FPIs | A mix of directional positioning and hedging against existing cash-market holdings |
| DIIs | Institutional positioning, often including hedges for domestic fund portfolios |
| Proprietary desks | Includes market-making and arbitrage activity, which can be directionally neutral rather than a “view” on price |
| Individual clients (retail) | A large and growing share of index options activity, per SEBI’s ongoing studies of the F&O segment |
This data is publicly available on the NSE website under its F&O reports section, alongside the standard daily OI figures covered in our option chain guide.
Edge Cases Where OI Readings Mislead
| What OI Appears to Show | What’s Actually Happening |
|---|---|
| OI in a stock’s futures “crashed” 40-50% overnight | Often a corporate action (bonus issue, stock split, large dividend) triggered an exchange adjustment to the contract’s strike price or lot size, not a mass exit of positions |
| A single stock option strike shows enormous OI relative to nearby strikes | Can reflect a small number of large positions (institutional hedges or writers), not broad participation – the OI number alone doesn’t reveal concentration |
| OI in a thinly traded contract swings sharply on a single trade | In illiquid contracts, one participant entering or exiting can move OI by a large percentage – the reading says little about overall market interest |
| Comparing this week’s Nifty monthly OI to last week’s weekly options OI | Different expiries naturally carry different OI levels simply due to how much time is left – comparing across expiry types without adjusting for that produces a misleading picture |
- OI often “migrates” rather than disappearing – near-month OI falling and next-month OI rising during expiry week can be the same positions rolling forward.
- Futures OI and options OI represent different kinds of positioning – options OI is heavily shaped by writers, including income-focused covered call strategies.
- Since October 2019, in-the-money stock derivatives are physically settled at expiry in India, unlike cash-settled index derivatives.
- NSE publishes participant-wise OI data (FPI, DII, proprietary, client) – useful context, but it still can’t distinguish a directional bet from a hedge.
- Corporate actions, illiquid contracts, and comparing across different expiry types can all make an OI reading look more dramatic than the underlying reality.
- None of this data is designed to generate a trading signal on its own – it’s context for understanding market structure, not a shortcut to predicting price.
Frequently Asked Questions
Why does open interest suddenly drop a lot during expiry week?
Is options OI the same kind of signal as futures OI?
What is participant-wise open interest data?
Why did a stock’s futures OI drop sharply after a bonus issue or stock split?
Can I use open interest patterns to time trades?
Where can I find NSE’s participant-wise OI reports?
Conclusion
Going beyond the basics of open interest means asking a different question than “is OI rising or falling?” It means asking which contract, which expiry, which participant category, and whether a structural event like a corporate action or a rollover explains what looks like a dramatic move.
None of this replaces the fundamentals – OI vs volume, how positions open and close, and the formula behind the number are still the foundation. This guide is for reading that number with the caveats a data-literate trader would apply, not for generating a signal to act on.