
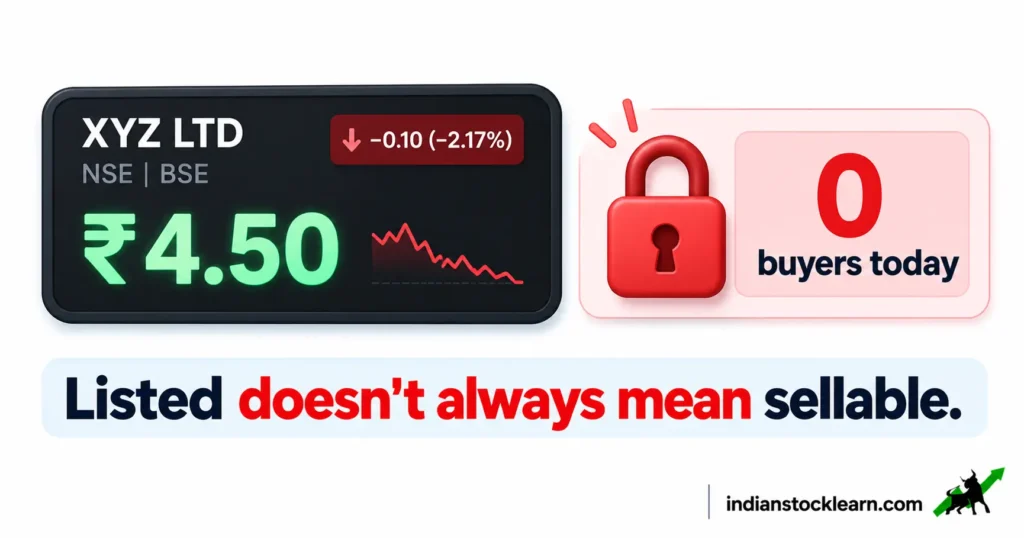
Penny stock liquidity risk is the gap between what a stock's price shows on screen and what you can actually get for your shares. This guide covers the mechanics behind that gap: surveillance frameworks, settlement rules, order book depth, and the 3 different ways a stock's story can end. It assumes you've read the beginner guide to penny stocks in India and understand the basics of liquidity and volatility already.
Nothing here is a buy, sell or hold recommendation.
- ASM and GSM: A Core Liquidity Risk
- The Trade-to-Trade Segment
- LTP vs the Price You Can Get
- Order Book Depth and Slippage
- Suspension, Delisting and Insolvency: 3 Different Endings
- What Happens to a Capital Loss When You Can't Sell
- A Liquidity-Aware Way to Size a Position
- Key Takeaways
- Frequently Asked Questions
- Conclusion
ASM and GSM: The Biggest Source of Penny Stock Liquidity Risk
Surveillance frameworks are one of the biggest sources of penny stock liquidity risk. SEBI and the exchanges run 2 overlapping frameworks: the Additional Surveillance Measure (ASM) and the Graded Surveillance Measure (GSM). Both flag stocks whose price movement looks disconnected from the business, and both escalate through stages rather than applying one fixed rule.
GSM's stages are the most clearly documented. As published by the exchanges:
| Stage | What it requires |
|---|---|
| Stage 1 | 100% margin, price band of 5% or lower |
| Stage 2 | Moves to Trade-to-Trade (T2T) settlement, 5% price band, buyers deposit an Additional Surveillance Deposit (ASD) of 50% of trade value |
| Stage 3 | T2T, 5% price band, ASD of 100% of trade value, trading permitted only once a week (usually Monday) |
| Stage 4 | T2T, 5% price band, ASD of 100% of trade value, once-a-week trading, with no upward price movement allowed |
The ASD is refunded if a stock moves down to a lower stage, but not simply because you sold your shares. ASM works on a similar principle of escalating margin and trading-frequency restrictions, reviewed periodically, though its exact stage structure has varied over time. Since these frameworks change, check the current stage list on the NSE website before assuming what applies.
The Trade-to-Trade Segment
Once a stock moves to T2T settlement, every trade must be settled by actual delivery of shares. You can't buy and sell the same share on the same day and net the difference, the way intraday trading normally works. Every purchase has to sit in your demat account before you can sell it.
This sounds purely protective, and in one sense it is: it removes speculative same-day flipping. The side effect is that it can drain a stock of its remaining trading activity, since traders looking for quick moves have no reason to be there anymore. A stock can be listed, inside its price band, and still see very few trades in a session.
Stocks under GSM or ASM surveillance are also typically not eligible to be pledged for margin with most brokers, since the exchanges apply a full haircut to them. If you were counting on using penny stock holdings as collateral for anything else, surveillance status usually rules that out. The shares still sit in your demat account regardless, whether or not you can trade or pledge them.
Penny Stock Liquidity Risk in Practice: LTP vs the Price You Can Get
The price shown on your broker app is the last traded price (LTP), the price at which the most recent trade happened. It is not a quote for what you can get right now, especially for a large order in a thin stock.
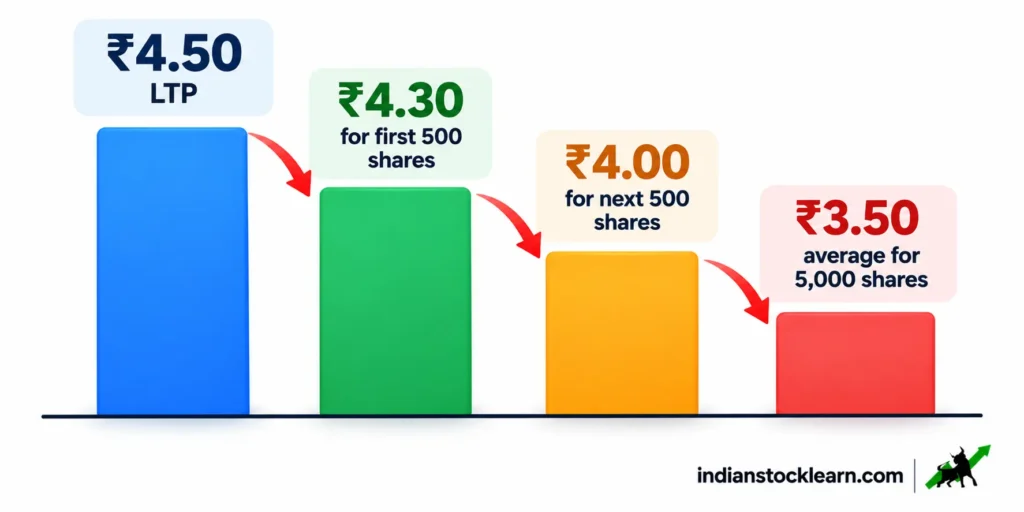
Take a hypothetical example. A stock's LTP is ₹4.50. Looking at the order book, the buy side shows 500 shares at ₹4.30, another 500 at ₹4.00, and nothing meaningful below that. If you try to sell 5,000 shares, the order works through each price level in turn, and your average realised price could land near ₹3.50, about 22% below the ₹4.50 you saw on screen.
This gap is called impact cost, and it exists on every stock, but it's usually small on a liquid large-cap and can be large on a thin penny stock. Checking the order book depth, most broker apps show at least 5 levels, before placing a sizeable order gives you a much better sense of your real exit price than the LTP alone.
Order Book Depth and Slippage
Order book depth is where penny stock liquidity risk becomes concrete rather than theoretical. A market order fills at whatever prices are available, working down through the order book until your full quantity is filled. In a thin stock, that can mean a materially worse average price than the LTP, exactly as the previous section's example showed.
A limit order avoids that by setting the worst price you'll accept, but it introduces a different problem: on a stock with few trades, a limit order can sit unfilled for a long stretch while the price drifts away from it. There's a genuine trade-off between certainty of execution and certainty of price, and it's sharper in illiquid stocks than in liquid ones.
Some brokers support a "disclosed quantity" setting, showing only part of your order size to the market at a time. This can reduce how much your own order moves the visible price, though it doesn't change how many actual buyers exist on the other side. Depth data is usually free on the broker apps compared in our Zerodha vs Groww vs Upstox comparison, so checking it costs nothing beyond a habit.
None of this is unique to any one broker or platform. It's a function of how thin the stock's own order book is, and it's the same penny stock liquidity risk whichever app shows you the price.
Suspension, Delisting and Insolvency: 3 Different Endings
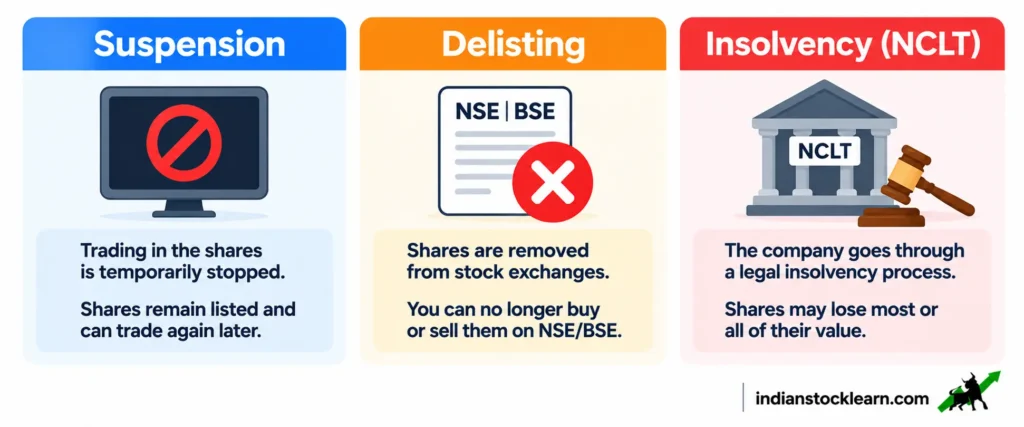
When a stock stops trading, the reason matters enormously for what happens to your shares next. This is penny stock liquidity risk at its most permanent: the difference between a pause and an ending.
| Outcome | What happens to the shares | What it means for you |
|---|---|---|
| Trading suspension | Shares remain in your demat account; trading is paused, often for non-compliance with listing rules | You still hold the shares; there may be no way to sell until trading resumes, which can take a long time or never happen |
| Voluntary or compulsory delisting | Shares are removed from the exchange; a delisting price or exit offer may be made to shareholders | You may be able to tender your shares at the offer price, or hold unlisted shares that trade, if at all, in informal markets at a steep discount |
| Insolvency resolution (NCLT/IBC) | An approved resolution plan can cancel the entire existing equity capital without any payout to shareholders | Equity holders sit behind lenders and creditors in the resolution process and often receive nothing |
Uttam Value Steels is the case referenced in the beginner guide: the National Company Law Tribunal approved a resolution plan in May 2020, trading was suspended on the exchanges from 23 November 2020, and the company was delisted on 1 December 2020, with the existing share capital cancelled without payout. That's the insolvency outcome in the table above, and it's the one that leaves equity holders with the least recourse.
What Happens to a Capital Loss When You Can't Sell
A falling or suspended stock doesn't automatically give you a claimable loss. Under Indian tax law, a capital loss is recognised only when a "transfer" of the asset takes place, and a price decline or a trading halt on its own isn't a transfer.
Courts and tribunals have held that a formal cancellation of shares, such as through an approved insolvency resolution or a capital reduction, does count as a transfer, which lets the loss be claimed in that year. Until such an event happens, your loss can sit unrecognised on paper for years, even though your portfolio screen already shows it. This is exactly why the insolvency outcome in the table above, however painful, at least gives shareholders a clear point at which the loss becomes real for tax purposes; simple suspension doesn't.
The specifics of when and how to claim this depend on your situation, so this is worth checking with a chartered accountant rather than treating it as a rule of thumb. This tax-timing gap is a quieter form of penny stock liquidity risk: the loss is real on your screen well before it's real on your tax return.
A Liquidity-Aware Way to Size a Position
Position sizing is the one place you can act on penny stock liquidity risk before it becomes a problem. Size is usually framed around how much you're willing to lose. In illiquid stocks, there's a second constraint worth thinking through: how much you could actually sell without moving the price against yourself.
One way to reason about this: compare your intended position size to the stock's recent average daily traded value.
| Average daily traded value | A position of | Is roughly |
|---|---|---|
| ₹5 lakh | ₹10,000 | 2% of a single day's turnover |
| ₹5 lakh | ₹1,00,000 | 20% of a single day's turnover |
| ₹5 lakh | ₹5,00,000 | 100% of a single day's turnover |
A position that's a large multiple of a stock's typical daily turnover can be hard to exit at anything close to the quoted price, regardless of where your stop-loss sits, because the stop-loss assumes a buyer exists at that price. These figures are illustrative arithmetic, not a rule to follow; the point is to compare your own numbers against the stock's own traded value before assuming an exit is available.
Key Takeaways
Every mechanic covered above is a different face of the same problem: penny stock liquidity risk.
- Surveillance: ASM and GSM escalate through stages, raising margin requirements and eventually limiting trading to once a week. It's a warning label, not a safety certificate.
- T2T: Trade-to-Trade settlement removes intraday squaring off and can further shrink a thin stock's remaining volume.
- LTP isn't your exit price: A thin order book means your real average sale price can sit well below the last traded price.
- Order type trade-off: Market orders risk a bad price; limit orders risk not filling at all in an illiquid stock.
- 3 different endings: Suspension, delisting and insolvency resolution leave shareholders in very different positions, and insolvency can cancel equity entirely.
- Capital loss timing: A price fall or trading halt alone usually isn't a recognised loss for tax purposes; a formal transfer or cancellation is.
- Size against liquidity: Compare your position size to the stock's own average daily traded value, not only to your stop-loss.
Frequently Asked Questions
What is penny stock liquidity risk?
What's the difference between ASM and GSM?
Why can't I sell my penny stock even though it's still listed?
What happens to my shares if the company is delisted?
Can I claim a tax loss on a suspended stock I can't sell?
Where should I start if I haven't read the basics yet?
Conclusion
Penny stock liquidity risk rarely shows up as a single dramatic event. It shows up as a gap, between the price you see and the price you can get, between being listed and being sellable, and between a paper loss and one you can actually claim. Surveillance stages, T2T settlement and order book depth are the mechanics behind that gap, and suspension, delisting and insolvency are 3 different ways the story can end for a shareholder.
None of this changes whether a specific penny stock is worth buying. It changes what you check before you do, and what you should expect if you can't sell when you want to. A stock further up the large cap, mid cap and small cap ladder carries far less of this particular risk, even when its business risk looks similar on paper.