
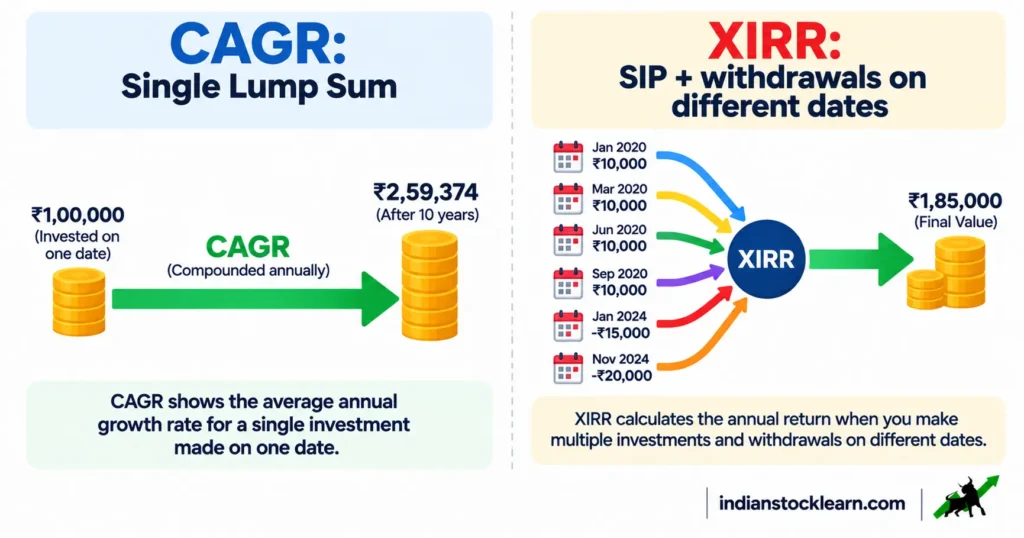
CAGR vs XIRR is the first fork in the road once you move past textbook compounding. CAGR works cleanly for a single lump sum invested once and withdrawn once. The moment you add SIPs, top-ups or partial withdrawals, CAGR quietly gives you the wrong number, and XIRR is what actually measures what happened. This guide assumes you’ve read the beginner guide to the power of compounding and are comfortable with the basic formula already.
Nothing here is a return projection or investment recommendation.
- CAGR vs XIRR: Why They Give Different Numbers
- A Worked CAGR vs XIRR Example
- Adjusting for Inflation: The Real Rate of Return
- Compounding Frequency and the Continuous Limit
- Where CAGR Hides the Real Story
- Sequence of Returns Risk
- Step-Up SIP vs Flat SIP
- Portfolio-Level Tactics That Affect Compounding
- Key Takeaways
- Frequently Asked Questions
- Conclusion
CAGR vs XIRR: Why They Give Different Numbers
CAGR (Compound Annual Growth Rate) answers one question: given a starting value and an ending value over a fixed number of years, what constant annual rate connects them? It assumes a single investment at the start and a single exit at the end, which makes it clean for a lump sum but wrong for a SIP.
XIRR (Extended Internal Rate of Return) solves a harder version of the same question: given several cash flows on several different dates, some going in and some coming out, what single annualised rate makes them all consistent? Every SIP instalment gets credit only for the time it actually spent invested, so an instalment from last month contributes far less to the final XIRR than one from 3 years ago. If you’re comparing a SIP against a lump sum, XIRR is the metric that actually makes that comparison fair.
| CAGR | XIRR | |
|---|---|---|
| Best for | A single lump-sum investment | SIPs, top-ups, partial withdrawals, any irregular cash flow |
| Assumes | One entry date, one exit date | Every cash flow has its own date and weight |
| Common tool | A = P(1 + r)ⁿ, solved for r | Excel/Sheets XIRR() function |
A Worked CAGR vs XIRR Example
Take a SIP of ₹5,000 a month for 12 months, ₹60,000 invested in total, with a value of ₹67,500 at the end of the 13th month.
A naive calculation looks simple: a gain of ₹7,500 on ₹60,000 invested is 12.5%. But that number treats every rupee as if it had been invested for the same length of time, and it wasn’t. The first instalment had close to a full year to grow; the last instalment had barely a month.
Feed the same 12 monthly outflows and the single final inflow into Excel or Google Sheets’ XIRR(values, dates) function, and the annualised return comes out closer to 23.5%, because XIRR correctly weights each instalment by how long it was actually invested. The 12.5% and 23.5% aren’t measuring different outcomes; they’re 2 different ways of describing the same outcome, and only one of them is annualised correctly.
=XIRR(values, dates). A rough starting guess of 10% usually helps the formula converge.
Adjusting for Inflation: The Real Rate of Return
A calculator’s growth number is a nominal return: what your rupee balance grew to. It says nothing about what that balance can actually buy. The real rate of return strips out inflation to answer that second question.
A commonly used approximation: real return ≈ nominal return − inflation rate. If an investment shows a 12% nominal return in a year when inflation ran at 6%, the real return is closer to 6%, not 12%. Over long periods this gap compounds too, so the difference between a nominal and a real compounding chart widens the further out you look.
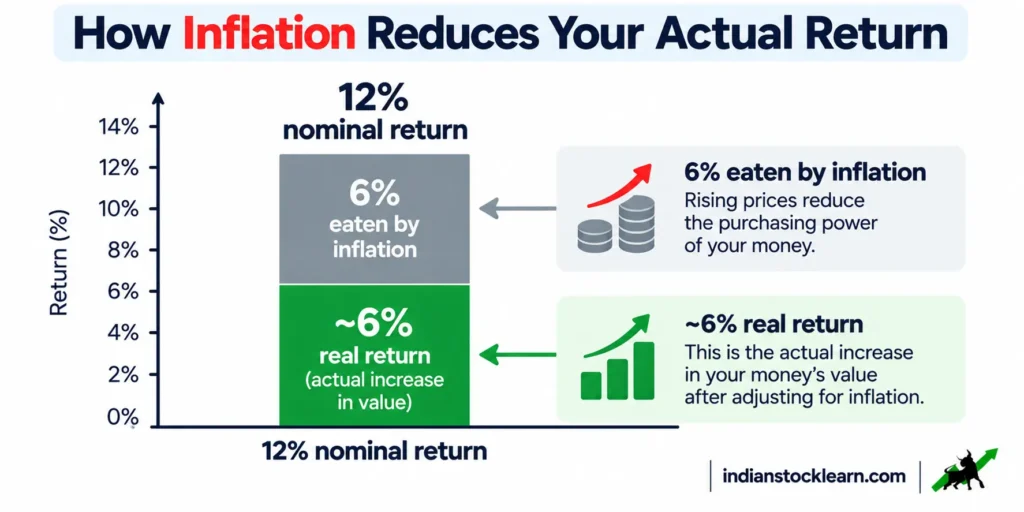
This matters most for long-horizon goals. A calculator showing your ₹10 lakh becoming ₹67 lakh in 20 years is a nominal projection; what that ₹67 lakh can buy in 20 years’ time is a smaller number once inflation has taken its share every single year along the way.
Compounding Frequency and the Continuous Limit
The basic formula A = P(1 + r)ⁿ assumes compounding once a year. Compound the same rate more often, monthly or daily, and the ending value is slightly higher, because each smaller period’s return starts earning its own return a little sooner.
Taken to its limit, compounding infinitely often gives the continuous compounding formula: A = Pe^(rt), where e is Euler’s number (≈2.71828). This is mostly a modelling tool, used in some financial formulas and bond pricing, rather than something you’ll encounter directly in a mutual fund statement. The practical takeaway is smaller than it sounds: moving from annual to monthly to continuous compounding at the same stated rate typically changes the ending value by a small amount, not a multiple.
Where CAGR Hides the Real Story
CAGR smooths away everything that happened between the start date and the end date. 2 investments can show the identical CAGR while one grew steadily and the other swung through large gains and losses on the way to the same endpoint.
That matters because the path affects the investor, not just the number on a report. A large drawdown in the middle of the period can test conviction, and an investor who exits during that drawdown never gets to the CAGR-matching endpoint at all. When comparing 2 investments with a similar CAGR, it’s worth asking how bumpy each path actually was, not just where each one ended up.
This is also why a single stock’s long-term CAGR can be a misleading headline on its own, the same caution that applies when reading a multibagger stock’s long-term chart: the CAGR is real, but it rarely describes what holding through the middle of that journey actually felt like.
Sequence of Returns Risk
The CAGR vs XIRR question compresses a journey into a single number, and that number hides something important: whether the good years and bad years happened early or late.
During accumulation, the order genuinely doesn’t matter, as long as you’re not adding or removing money along the way. Take the same 10 annual returns (+15%, +12%, -20%, +8%, +18%, -15%, +10%, +20%, +5%, +12%) and run them in reverse order on a ₹10 lakh lump sum with no withdrawals: both sequences end at the identical ₹17.3 lakh. Multiplication doesn’t care about order.
Add a fixed annual withdrawal into that same 10-year sequence, say 8% of the starting corpus taken out every year, a rough stand-in for a retiree drawing income, and the order suddenly matters a great deal. Running the original sequence (the -20% year arrives 3rd) against the reversed one (the -20% year arrives 8th) on a ₹1 crore starting corpus:
| Sequence | When the -20% year hits | Ending corpus after 10 years |
|---|---|---|
| Original order | Year 3 | ≈ ₹63.9 lakh |
| Reversed order | Year 8 | ≈ ₹75.2 lakh |
Same 10 returns, same average, same withdrawal amount every year, about a 15% gap in what’s left at the end, purely from when the bad year landed relative to the withdrawals. A loss early in the withdrawal phase forces you to sell a larger share of a smaller base, and that share never gets to participate in the recovery.
Common ways investors manage this risk: keeping a few years of expected withdrawals in debt or liquid instruments rather than equity, so a market fall doesn’t force equity sales at depressed prices, and gradually shifting a portfolio’s mix as a withdrawal phase approaches rather than staying at a fixed equity allocation throughout. Both are general approaches, not a specific allocation to follow; the right mix depends on your own situation.
Step-Up SIP vs Flat SIP
Neither CAGR vs XIRR nor a static assumed rate captures this next point: a SIP that never changes ignores that most people’s incomes grow. A step-up SIP raises the monthly contribution by a fixed percentage each year, typically timed to a salary increment.
Take a ₹10,000 monthly SIP at an assumed 12% annual return over 20 years:
| SIP structure | Total invested | Approximate corpus after 20 years |
|---|---|---|
| Flat ₹10,000/month | ₹24 lakh | ≈ ₹1.0 crore |
| ₹10,000/month, stepped up 10% every year | ≈ ₹68.7 lakh | ≈ ₹1.97 crore |
The step-up version invests roughly 2.9 times as much over 20 years and ends with roughly double the flat SIP’s corpus. The lesson isn’t that a specific step-up percentage is right for everyone; it’s that indexing contributions to rising income is a lever most flat-SIP illustrations don’t show at all.
Portfolio-Level Tactics That Affect Compounding
A few portfolio-level choices change how much of a calculated return actually compounds forward, separate from picking the underlying investments.
- Rebalancing: periodically bringing a portfolio back to its intended mix, for example by trimming what’s grown and adding to what hasn’t, is one way some investors try to buy relatively low and sell relatively high without timing the market. It has trade-offs of its own, including transaction costs and possible tax events, so it isn’t a free source of extra return.
- Tax-aware account placement: Indian instruments broadly fall into 3 tax treatments: some are tax-free at contribution, growth and withdrawal; some defer tax to withdrawal; and some, including most direct equity and dividend payouts, are taxed along the way. Which bucket an investment sits in changes how much of its nominal return survives into compounding, though the specific rules and current rates should be checked against current guidance rather than a fixed figure here.
- Compounding can run against you too: the same formula that grows an investment also grows an unpaid debt. Credit card balances carried month to month in India commonly run at 30%-48% annualised, and a minimum-payment structure is built around that balance compounding against you for as long as you carry it. Clearing high-cost debt is itself a guaranteed return equal to whatever rate stops compounding.
- Reinvestment choices: a dividend that’s automatically reinvested compounds immediately; one that sits in a settlement account earning nothing doesn’t. Over many years, this operational detail alone can separate 2 otherwise identical portfolios.
None of these tactics change CAGR vs XIRR mechanics directly, but they change the underlying return an investment generates. They change how much of that return you actually get to keep compounding. A portfolio spread across large cap, mid cap and small cap holdings, and across a few different sectors per the diversification guide, gives rebalancing something meaningful to work with in the first place.
Costs sit underneath all of this too. A fund’s expense ratio is deducted before you ever see a return figure, so 2 funds tracking the same index can compound to noticeably different endpoints over 20 years purely on cost. Our expense ratio guide covers how to compare that cost across funds.

Key Takeaways
Every section above comes back to the same foundation: CAGR vs XIRR, and what each one actually tells you.
- CAGR vs XIRR: CAGR fits a single lump sum; XIRR is the correct tool once money moves in and out on different dates, as with any SIP.
- Worked example: a ₹60,000 SIP growing to ₹67,500 in a year looks like a 12.5% absolute gain but works out to roughly 23.5% on an XIRR basis.
- Nominal vs real: a nominal return has to be adjusted for inflation before it tells you anything about purchasing power.
- Compounding frequency: more frequent compounding raises the ending value slightly; the continuous compounding formula A = Pe^(rt) is the mathematical limit of that effect.
- CAGR smooths the path: 2 investments with the same CAGR can have had very different journeys to get there.
- Portfolio choices matter: rebalancing, tax-aware placement and reinvestment discipline all affect how much return actually compounds forward.
- Sequence matters in withdrawal: the order of returns doesn’t change a pure accumulation outcome, but with regular withdrawals, the same returns in a different order can leave a meaningfully different final corpus.
- Step-up beats flat: indexing SIP contributions to rising income can roughly double a 20-year corpus compared with a flat SIP, without needing a higher assumed return.
Frequently Asked Questions
What’s the actual difference between CAGR vs XIRR?
Why does my SIP’s XIRR look higher than its absolute return?
How do I calculate XIRR in Excel or Google Sheets?
What is the real rate of return?
Does compounding monthly instead of annually make a big difference?
Does the order of returns really matter if the average is the same?
Is a step-up SIP always better than a flat SIP?
Where should I start if CAGR and XIRR are new to me?
Conclusion
CAGR vs XIRR is really a question of which tool matches how you actually invest. A single lump sum is fairly measured by CAGR; a SIP, with money going in on different dates, needs XIRR to say anything accurate about your annualised return. Both numbers describe compounding correctly for the situation they were built for, and neither is more “true” than the other in the abstract.
Inflation adjustment, compounding frequency and portfolio-level choices like rebalancing and reinvestment sit on top of that same foundation. None of them change what compounding fundamentally is; they change how much of it you actually experience by the time you check your own numbers.