
Last Updated: October 1, 2026
Multibagger stock analysis finds out why a stock’s price multiplied: business growth, a higher valuation, a smaller share count, or a mix of all 3. This guide assumes you already know EPS, PE, ROE and ROCE. If you’re starting from zero, read the beginner guide to multibagger stocks first.
Each step below comes with worked numbers and no stock recommendations.
- What Multibagger Stock Analysis Covers
- Split the Return: EPS Growth × PE Change
- From Revenue to EPS
- Dilution, Buybacks and Acquisitions
- Corporate Actions and Dividends in Your Returns
- Growth Stocks vs Cyclical Stocks
- ROE, ROCE and Debt in Context
- Multibagger Stock Analysis Checklist: Track the Thesis
- Position Size Arithmetic
- Key Takeaways
- Frequently Asked Questions
- Conclusion
What Multibagger Stock Analysis Covers
Screeners list stocks that passed a filter. Multibagger stock analysis takes a stock that has already moved and asks where the return came from and whether it can repeat.
The workflow has 5 steps: split the price return into EPS and PE, trace EPS back to revenue, margins and share count, adjust for corporate actions and dividends, read ratios in the right business context, and track the thesis each year.
Multibagger stock analysis suits readers who already open annual reports and want to test claims such as “10x in 10 years” against the numbers. A 10x in 10 years needs about 26% growth every year, and the steps below show how much of that growth came from the business.
On 22 September 2026, BusinessToday reported that Cupid Ltd shares were up about 6,193% over 3 years. A headline like that gives the price return only. It doesn’t show how much came from earnings and how much from a higher PE, which is the split the next section teaches you to make.
Split the Return: EPS Growth × PE Change
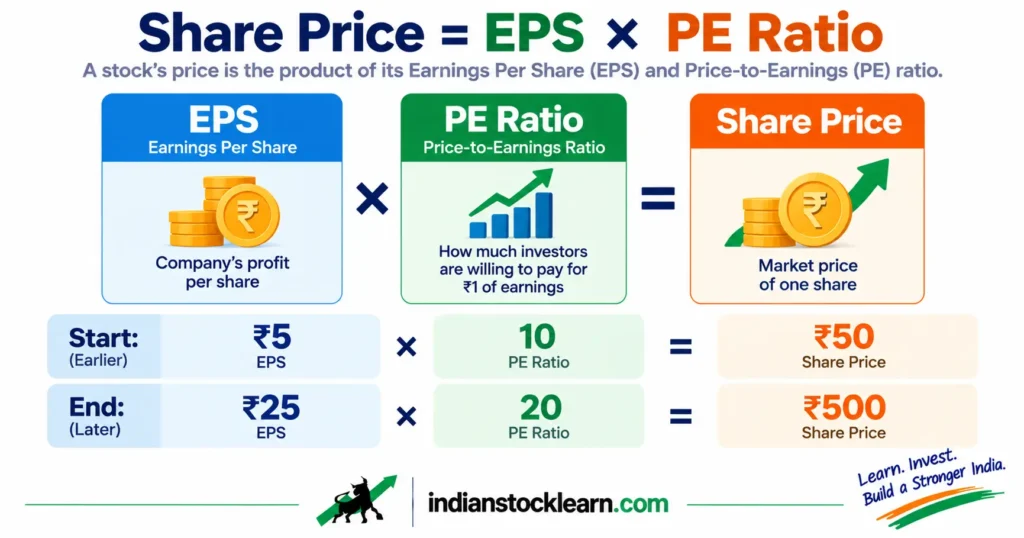
Share price equals earnings per share (EPS) times the PE ratio. That means a stock’s price multiple equals its EPS multiple times its PE multiple.
Take a stock with EPS of ₹5 and a PE of 10, so it trades at ₹50. 10 years later, EPS is ₹25 and PE is 20, so the price is ₹500. The price rose 10x: EPS grew 5x and PE grew 2x (5 × 2 = 10).
| Scenario | EPS multiple | PE multiple | Price multiple |
|---|---|---|---|
| Growth plus re-rating | 5x | 2x | 10x |
| All business growth | 10x | 1x | 10x |
| PE falls by half | 10x | 0.5x | 5x |
| Mostly a higher PE | 2x | 5x | 10x |
Stocks with an identical 10x price can tell very different stories. A return built mostly on a higher PE can reverse if the PE falls back, while a return built on EPS growth needs the business to keep delivering.
To split a real stock’s return, take EPS and PE at the start and end dates from the company’s annual reports on the NSE website or a data site, then divide the end value by the start value for each. Our PE ratio guide covers how PE itself is calculated.
From Revenue to EPS
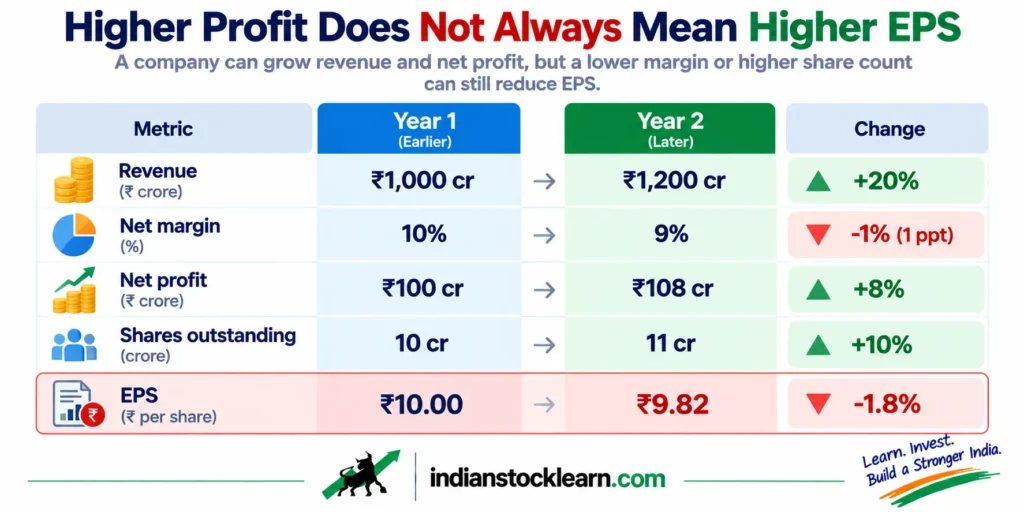
EPS sits at the end of a chain: revenue, operating profit, net profit, and then a division by the number of shares. A weak link anywhere in that chain makes EPS grow slower than sales.
| Item (hypothetical company) | Year 1 | Year 2 | Change |
|---|---|---|---|
| Revenue | ₹1,000 crore | ₹1,200 crore | +20% |
| Net margin | 10% | 9% | −1 point |
| Net profit | ₹100 crore | ₹108 crore | +8% |
| Shares outstanding | 10 crore | 11 crore | +10% |
| EPS | ₹10.00 | ₹9.82 | −1.8% |
Sales grew 20% and EPS fell 1.8%. Slipping margins and newly issued shares caused it. Read all 5 lines of the chain, and don’t stop at the first one.
Repeat this check across 5 years of results. A single year can mislead, while a 5-year gap between sales growth and EPS growth shows a pattern worth investigating.
Dilution, Buybacks and Acquisitions
The share count decides how much of a company’s growth reaches each shareholder. Companies add shares through fresh equity issues, preferential allotments, warrants and employee stock options. A rights issue also adds shares, but existing holders get the first right to buy them.
If a company’s market cap grows 10x while its share count grows 3x, the share price rises only about 3.3x (10 ÷ 3). Your return follows the share price, and the market cap headline overstates it.
A buyback works in the other direction. When a company retires shares, EPS can rise even if profit stays flat. The buyback guide explains the mechanics.
Acquisitions add revenue the company didn’t build itself. Check whether reported growth comes from the existing business or from purchases, since acquired growth needs cash, debt or new shares to fund it. The annual report’s notes on business combinations and share capital show which it was.
Corporate Actions and Dividends in Your Returns
A stock split or bonus issue changes the price per share without changing what the company is worth. Bajaj Finance traded ex-bonus and ex-split on 16 June 2025 after a 4:1 bonus and a 2:1 split. The price went from about ₹9,300 on 13 June to about ₹955 on 16 June, a 10x cut in price per share against 10x as many shares (Business Standard).
Demergers work differently. When Reliance Industries demerged Jio Financial Services in July 2023, each Reliance share brought 1 Jio Financial Services share, with a record date of 20 July 2023 and listing on 21 August 2023. Holders’ original cost was divided between the 2 companies, 95.32% to Reliance and 4.68% to Jio Financial Services. A price chart of the parent alone can hide the value that moved to the new company.
Dividends belong in the return too. Price return counts only the change in share price, while total return adds the dividends you received. Buy at ₹100, see the price reach ₹500 after 10 years and collect ₹40 in dividends, and your total value is ₹540, or 5.4x versus 5x (before counting any reinvestment).
CAGR works when you invest once and sell once. If you add money in instalments or receive dividends along the way, use XIRR, which weights every cash flow by its date. Excel and Google Sheets both have an XIRR function.
Growth Stocks vs Cyclical Stocks
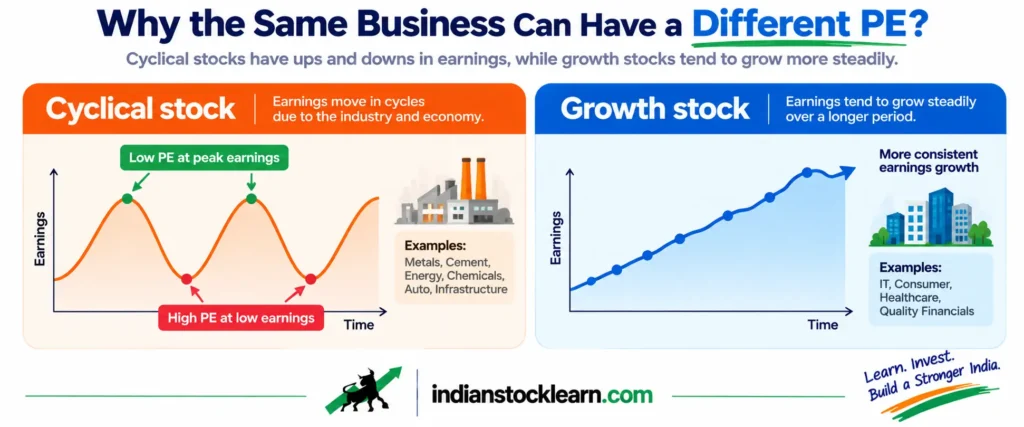
Growth stocks earn more each year through most of the cycle. Cyclical stocks, such as those in steel, cement, shipping or commodities, earn in waves that follow the economic or commodity cycle.
That flips how PE reads. At the top of a cycle earnings are high, so PE looks low and the stock looks cheap. At the bottom earnings are depressed, so PE looks high, or can’t be calculated when earnings turn negative.
| Variable | Growth stock | Cyclical stock |
|---|---|---|
| Earnings pattern | Rise in a steady trend | Rise and fall with the cycle |
| What a low PE can mean | Cheap, or weak growth expected | Earnings near a peak |
| What a high PE can mean | Growth already priced in | Earnings near a low |
| Metrics that help | EPS growth, ROCE, reinvestment runway | Price-to-book, normalised earnings, capacity use |
| Common trap | Paying too much for growth | Buying late in the upcycle |
| First check | How long growth can last | Where the business sits in its cycle |
A screen for profit growth above 15% a year can pick up a cyclical stock at the top of its cycle. Decide whether a stock is a growth story or a cycle story before you apply a growth screen. Multibagger stock analysis of a cyclical stock swaps PE for cycle-aware metrics such as price-to-book and normalised earnings. The large cap, mid cap and small cap guide helps you place the company by size first.
ROE, ROCE and Debt in Context
The same ratio gives different answers in different businesses, so read each one with its context.
| Ratio | What it shows | Common misread |
|---|---|---|
| ROE | Profit earned on shareholders’ equity | It rises when a company borrows heavily, because debt shrinks the equity share of capital |
| ROCE | Profit earned on all capital, debt included | Levels differ across industries, so compare within one industry |
| Debt-to-equity | How much borrowing funds the business | High debt is normal for lenders such as banks and NBFCs, where borrowed money is the raw material |
| Free cash flow | Cash left after capital spending | It can be negative while a company builds capacity, so ask whether the spending earns a return |
For lenders, a low-debt screen removes the whole sector before you look at a single company. Return ratios and asset quality tell you more there. The free Zerodha Varsity fundamental analysis module covers each ratio in detail.
Multibagger Stock Analysis Checklist: Track the Thesis
Finding a candidate is the start. A thesis is a written reason for owning the business, such as “revenue can grow 15% a year for 5 years because the company keeps adding stores.” Write it before you look at the current price, then test it every year. A written thesis keeps multibagger stock analysis tied to the business and away from the chart.
| What to monitor | Question to ask |
|---|---|
| Revenue | Is demand expanding? |
| Margins | Is growth improving the economics? |
| ROCE | Does new capital earn a worthwhile return? |
| Cash flow | Do reported profits turn into cash? |
| Debt | Is balance-sheet risk rising? |
| Share count | Are existing shareholders being diluted? |
| Valuation | Has the price moved far ahead of business results? |
| Thesis | What evidence would prove the original idea wrong? |
Keep 2 kinds of alerts apart. A price alert says the market moved. A thesis alert says the business changed. A 20% price fall with sales, margins and debt intact is a price alert, while repeated equity dilution or a lasting margin decline is a thesis alert. The checklist organises your own research and gives no buy or sell signals.
Position Size Arithmetic
A multibagger changes your portfolio in proportion to its weight. If nothing else moves, the portfolio gain equals weight × (stock multiple − 1).
| Portfolio weight | Stock multiple | Portfolio gain |
|---|---|---|
| 2% | 10x | 18% (2% × 9) |
| 5% | 5x | 20% (5% × 4) |
| 15% | 3x | 30% (15% × 2) |
Weights drift as well. A 2% position that grows 10x while the rest of the portfolio stays flat becomes about a 17% position (20 ÷ 118).
Now take 10 equal positions where 2 stocks reach 5x, 6 stay flat and 2 fall 50%. The portfolio ends at (2 × 5 + 6 × 1 + 2 × 0.5) ÷ 10 = 1.7x, a 70% gain, and the 2 winners carried it. These numbers illustrate the arithmetic and recommend no allocation. Spreading money across companies is covered in the diversification guide.
Key Takeaways
- Price = EPS × PE: Multibagger stock analysis starts by splitting a return into EPS growth and PE change.
- EPS chain: Sales growth can become slower EPS growth through margins, interest, tax and new shares.
- Share count: Dilution cuts your share of the growth, and buybacks raise it.
- Adjustments: Splits, bonus issues, demergers and dividends change how a return reads, and XIRR handles irregular cash flows.
- Cycles: Cyclical stocks show a low PE at peak earnings and a high PE at the bottom, so ask growth story or cycle story first.
- Ratios: ROE needs debt for context, and normal debt levels differ for lenders.
- Thesis and size: Separate price alerts from thesis alerts, and remember that weight decides a winner’s impact on the portfolio.
Frequently Asked Questions
What is multibagger stock analysis?
How do I split a stock’s return into EPS growth and PE change?
Why can EPS grow slower than revenue?
Does a stock split change a multibagger’s return?
Does a low PE ratio mean a stock is cheap?
Should I use CAGR or XIRR to measure returns?
Where should I start if EPS and PE are new to me?
Conclusion
Multibagger stock analysis comes down to 1 question: where did the return come from? EPS growth, a higher PE, a smaller share count and dividends each add a piece, and each piece has a different chance of repeating. Splitting a return into those pieces turns a headline number into something you can judge.
Corporate actions, business cycles and ratio context change how the same numbers read, and a yearly thesis check keeps the work current. The arithmetic explains how past returns formed and makes no prediction about the next multibagger.